
The Dogecoin price prediction shows that DOGE remains at the downside, and the coin is likely to dip below the channel.
Dogecoin Prediction Statistics Data:
- Dogecoin price now – $0.08
- Dogecoin market cap – $10.7 billion
- Dogecoin circulating supply – 132.6 billion
- Dogecoin total supply – 132.6 billion
- Dogecoin Coinmarketcap ranking – #10
DOGE/USD Market
Key Levels:
Resistance levels: $0.11, $0.12, $0.13
Support levels: $0.05, $0.04, $0.03
DOGE/USD is moving sideways as the coin remains below the 9-day and 21-day moving averages. Currently, the coin is trading at $0.08, and it is likely to create more downside as revealed by the technical indicators. However, the Doge price may head towards the lower boundary of the channel if the bears put more pressure.
Dogecoin Price Prediction: DOGE/USD May Consolidate Within the Moving Average
At the time of writing, the Dogecoin price is heading to the downside, and a move below the lower boundary of the channel; may increase the short-term selling pressure, which could hit the next supports at $0.05, $0.04, and $0.03. On the other hand, any bullish movement above the 9-day and 21-day moving averages could push the coin towards the resistance levels of $0.11, $0.12, and $0.13.

Moreover, the Dogecoin could start a new bullish session, but the session may not last long as the 9-day moving average remains below the 21-day moving average. So, it is important to note that the next support level may come at $0.06 as other indicators like the Relative Strength Index (14) and the Moving Averages (MA) confirms the next direction that the coin may follow.
DOGE/BTC Market: Price May Continue to Move Sideways
Compared with Bitcoin, the market price remains within the channel, trading at 271 SAT below the 9-day and 21-day moving averages. Looking at the daily chart, if the coin can break above the moving averages, the bulls may end up dominating the market.
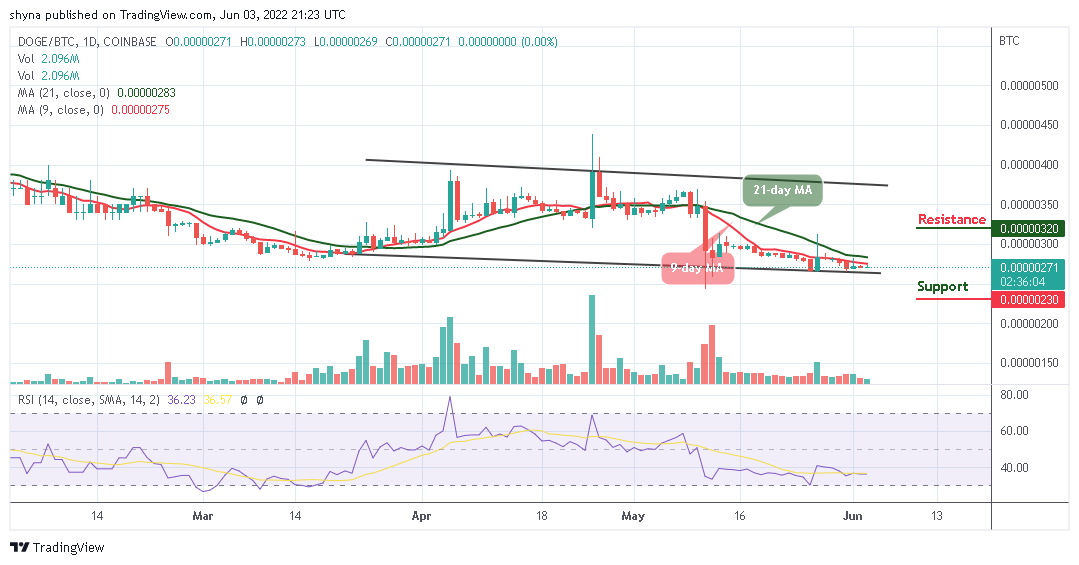
However, if the market drops below the lower boundary of the channel, the next key support may come at 230 SAT and below. On the bullish side, a possible rise towards the upper boundary of the channel could hit the resistance level of 320 SAT and above. According to the technical indicator Relative Strength Index (14), the market may continue to move sideways as the signal line moves below the 40-level.
eToro – Our Recommended Crypto Wallet
- Exchange Wallet for 120+ Cryptocurrencies, Trade In-Wallet
- Automatic Staking of ETH, ADA or TRX in your Wallet
- Regulated by FCA, ASIC and CySEC – Millions of Users
- Unlosable Private Key – Secure eToro Recovery Service
68% of retail investor accounts lose money when trading CFDs with this provider.
Read more:
Credit: Source link


 Bitcoin
  Ethereum
  Tether
  BNB
BNB  Solana
  USDC
USDC  XRP
XRP  Dogecoin
  Toncoin
  Cardano
  Shiba Inu
  Avalanche
  Wrapped Bitcoin
  Polkadot
  Bitcoin Cash
  NEAR Protocol
  Polygon
  Litecoin
  Fetch.ai
  Uniswap
  LEO Token
  Hedera
  Aptos
Aptos  First Digital USD
  Render
  Cosmos Hub
  Pepe
Pepe  Filecoin
  Immutable
  dogwifhat
  Stellar
  Wrapped eETH
  XT.com
  Bittensor
  OKB
OKB  Optimism
  Arbitrum
  The Graph
  Maker
Maker 
