
Join Our Telegram channel to stay up to date on breaking news coverage
Dogecoin (DOGE) Price Prediction – November 1
The present buying positions’ prevalence force shows the Dogecoin market operation trends higher against the US Dollar to a large extent. Price has exchange values between the high and the low-value lines of $0.1589 and $0.1245 at a positivity percentage rate of 10.01 at the time of writing.
DOGE/USD Market
Key Levels:
Resistance levels: $0.16, $0.17, $0.18
Support levels: $0.10, $0.09, $0.08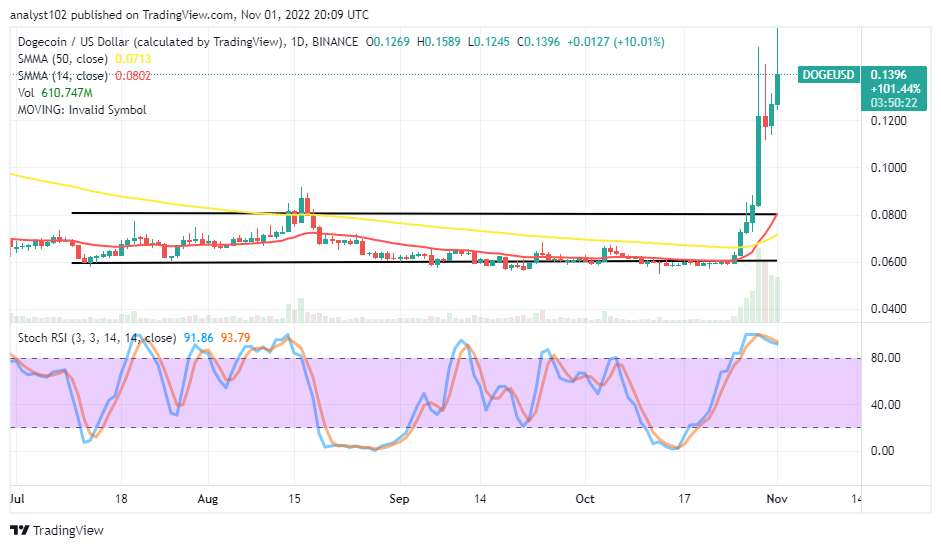 DOGE/USD – Daily Chart
The DOGE/USD daily chart showcases the crypto market trends higher to surpass some series of resistances far over the trend lines of the SMAs. Initially, the crypto trade featured in range-bound zones characterized by $0.06 and $0.08 range values. The 14-day SMA indicator is at $0.0802 above the $0.0713 value point of the 50-day SMA indicator. The Stochastic Oscillators are in the overbought region, trying to conjoin southbound at 93.79 and 91.86 range values.
What kind of pattern might the DOGE/USD develop around its current trading zones?
It has been that the DOGE/USD market trends higher to a high-resistance trading spot capable of reproducing a retracement in the near session. When such scenario materializes, those who are opening long positions will have to stop doing so until the market experiences a correction, which will in the long or medium term, produce a new outlook and propose a good re-buying mode at a lower trading spot.
On the downside of the technical analysis, the DOGE/USD market bears may have to make use of a 1-hour chart to decide when there’ll be active price reversal motions before dimming it fit to launch a sell order. However, a sudden pump, breaking through the $0.16 resistance level, will put sellers to look for a higher trading point around the $0.17resistance line before reconsidering the execution of the sell order.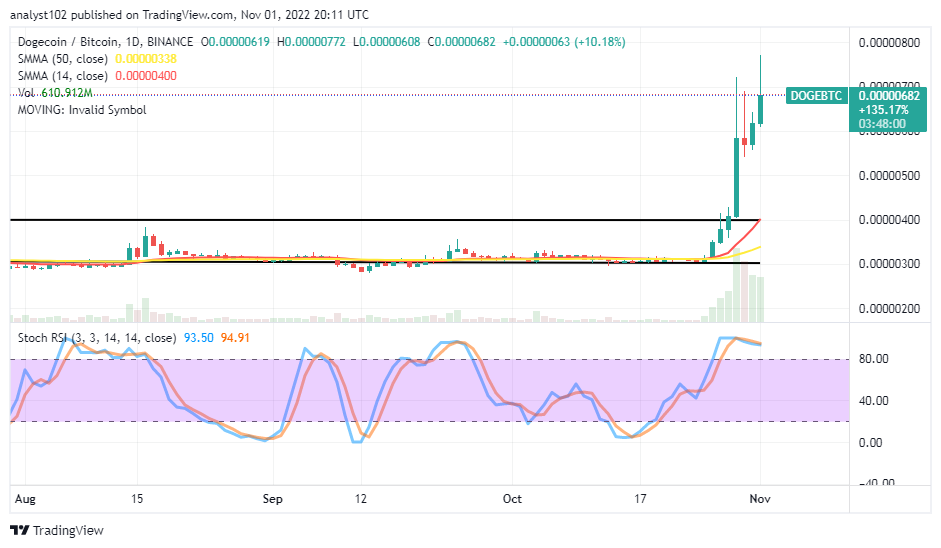
DOGE/BTC Price Analysis
The Dogecoin market trends higher against the trending catalyst of Bitcoin. Variant trading candlesticks are around high-trading zones far over the SMA trend lines. The 14-day SMA indicator is above the 50-day SMA indicator, pointing toward the north at a barrier-trading spot where the shooting-up motion took effect. The Stochastic Oscillators are in the overbought region, with their lines clogged slightly southbound at 94.91 and 93.50 range values to indicate that the base crypto is somewhat losing the energy to hold further against the counter-crypto.
The Dash 2 Trade presale has raised more than $3 million since it started more than two weeks ago. This token sale is one of the most heated this year.
Related
Dash 2 Trade – High Potential Presale
- Active Presale Live Now – dash2trade.com
- Native Token of Crypto Signals Ecosystem
- KYC Verified & Audited
Join Our Telegram channel to stay up to date on breaking news coverage
Credit: Source link


 Expected to Outperform Cardano (ADA)")


 As ‘Next Amazon’: Price Targets")
")


 Bitcoin
  Ethereum
  Tether
  BNB
BNB  Solana
  USDC
USDC  XRP
XRP  Dogecoin
  Toncoin
  Cardano
  Shiba Inu
  Avalanche
  Wrapped Bitcoin
  Polkadot
  Bitcoin Cash
  NEAR Protocol
  Polygon
  Litecoin
  Uniswap
  LEO Token
  Fetch.ai
  Render
  First Digital USD
  Hedera
  Aptos
Aptos  Cosmos Hub
  Pepe
Pepe  Filecoin
  Wrapped eETH
  Stellar
  OKB
OKB  Immutable
  dogwifhat
  Optimism
  Arbitrum
  Bittensor
  Arweave
  The Graph
