
The Polkadot price prediction could set a bullish run if the market attempts to climb back above the resistance level of $10.
Polkadot Prediction Statistics Data:
- Polkadot price now – $9.44
- Polkadot market cap – $9.3 billion
- Polkadot circulating supply – 987.5 Million
- Polkadot total supply – 1.1 billion
- Polkadot Coinmarketcap ranking – #11
DOT/USD Market
Key Levels:
Resistance levels: $14, $15, $16
Support levels: $6, $5, $4
At the moment, DOT/USD is at the movement running a little retracement move towards $10 with price growth of 0.85%. For the fact that the coin is recording a little gain, the Polkadot price may continue to maintain a sideways movement within the channel. Therefore, traders can expect the price to rise as soon as the bulls put more pressure on the market.
Polkadot Price Prediction: What to Expect from Polkadot (DOT)
If the Polkadot price stays below the 9-day and 21-day moving averages, the market price may slide towards the lower boundary of the channel. But if the price follows the upward movement, traders can expect a bullish continuation above the upper boundary of the channel. Meanwhile, as the technical indicator Relative Strength Index (14) is seen moving around 40-level, the possible resistance levels could be found at $14, $15, and $16 in the long term.

However, if the coin resumes the bullish movement in the next couple of days, traders may witness the Polkadot price reach higher levels. Meanwhile, DOT/USD is still moving sideways. Inversely, a bearish movement could roll the coin to the long-term support at $6, $5, and $4 levels.
Against Bitcoin, Polkadot continues to follow the sideways movement but is trading below the 9-day and 21-day moving averages. In case of a trend reversal, there is a need for an increasing volume and resistance to cause an upsurge in the market. At the moment, Polkadot (DOT) is trading around 3180 SAT. Therefore, traders can expect a close support level at 2500 SAT and below.
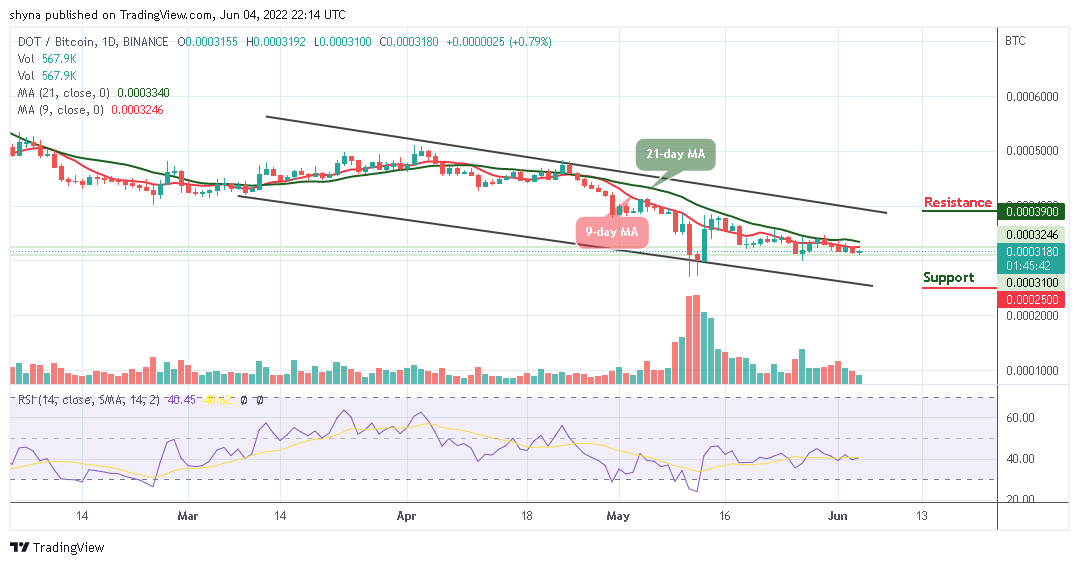
However, if a bullish move occurs and validates a break significantly above the 9-day and 21-day moving averages to hit the nearest resistance at 3500 SAT; traders can confirm a bullish movement for the coin, and the closest resistance lies at 4300 SAT and above. The technical indicator Relative Strength Index (14) is moving around 40-level, suggesting sideways movement.
eToro – Our Recommended Crypto Wallet
- Exchange Wallet for 120+ Cryptocurrencies, Trade In-Wallet
- Automatic Staking of ETH, ADA or TRX in your Wallet
- Regulated by FCA, ASIC and CySEC – Millions of Users
- Unlosable Private Key – Secure eToro Recovery Service
68% of retail investor accounts lose money when trading CFDs with this provider.
Read more:
Credit: Source link


 Raised $7.5 Million In Presale, Selling Fast")


 Bitcoin
  Ethereum
  Tether
  BNB
BNB  Solana
  USDC
USDC  XRP
XRP  Dogecoin
  Toncoin
  Cardano
  Shiba Inu
  Avalanche
  Polkadot
  Wrapped Bitcoin
  Bitcoin Cash
  NEAR Protocol
  Polygon
  Litecoin
  LEO Token
  Uniswap
  First Digital USD
  Aptos
Aptos  Hedera
  Cosmos Hub
  Stellar
  Filecoin
  OKB
OKB  Render
  Immutable
  XT.com
  Pepe
Pepe  Arbitrum
  Optimism
  Sui
Sui  dogwifhat
  Bittensor
  Wrapped eETH
  Maker
Maker 
