
Join Our Telegram channel to stay up to date on breaking news coverage
The Polkadot (DOT) price prediction may cross into the negative side as the price moves around the 9-day moving average.
Polkadot Prediction Statistics Data:
- Polkadot price now – $6.38
- Polkadot market cap – $7.1 billion
- Polkadot circulating supply – 1.1 billion
- Polkadot total supply – 1.2 billion
- Polkadot Coinmarketcap ranking – #11
DOT/USD Market
Key Levels:
Resistance levels: $8.5, $9.5, $10.5
Support levels: $4.5, $3.5, $2.5
Buy Polkadot Now
Your capital is at risk

DOT/USD price may drop lower if the coin finds support at the $6 level but during the European session today, Polkadot (DOT) tried to cross above the 9-day moving average before falling back to where it is currently trading at the $6.38 level. At the moment, if the bears continue to push the market further lower, immediate support below the $6.2 level may be located. Beneath this, further supports may be found at $4.5, $3.5, and $2.5 respectively.
Polkadot Price Prediction: DOT Price May Follow the Sideways Movement
As the daily chart reveals, if the buyers can hold the current market value at $6.38 and the Polkadot price begins to climb higher, bulls may expect immediate resistance to be located at $7.0, which is above the 9-day and 21-day moving averages. However, moving a little bit higher may locate the higher resistance levels at $8.5, $9.5, and $10.5. Meanwhile, the technical indicator Relative Strength Index (14) is seen ranging above the 40-level, which shows that the market may follow the sideways movement.
Against Bitcoin, the Polkadot is trading below the 9-day and 21-day moving averages. Therefore, if the price actions remain below this barrier, Polkadot may perpetually be under the control of a bear. Meanwhile, traders need more strong and more consistent resistance to keep the price from the bear run.
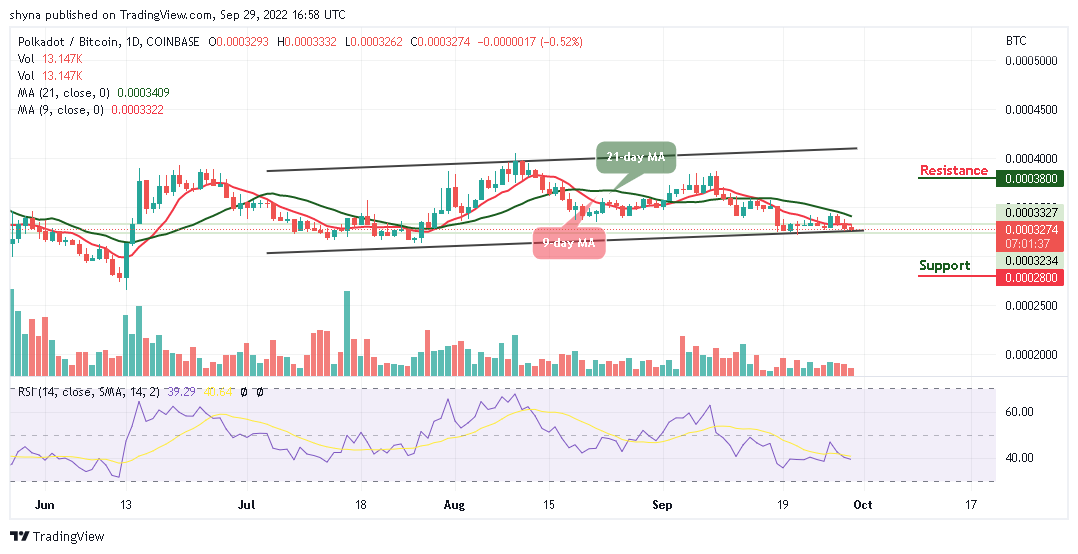
However, with the current movement in the daily chart, if the price crosses above the 9-day and 21-day moving averages, heading towards the upper boundary of the channel could meet the potential resistance level at 3800 SAT and above. Meanwhile, if the market price crosses below the lower boundary of the channel, it may hit the critical support at 2800 SAT and below as the technical indicator Relative Strength Index (14) crosses below the 40-level.
Tamadoge – Play to Earn Meme Coin

- Earn TAMA in Battles With Doge Pets
- Capped Supply of 2 Bn, Token Burn
- Presale Raised $19 Million in Under Two Months
- Upcoming ICO on OKX Exchange
Join Our Telegram channel to stay up to date on breaking news coverage
Credit: Source link


, Ripple (XRP), and Cardano (ADA) Indicate for Investors?")


 Bitcoin
  Ethereum
  Tether
  BNB
BNB  Solana
  USDC
USDC  XRP
XRP  Dogecoin
  Toncoin
  Cardano
  Shiba Inu
  Avalanche
  Wrapped Bitcoin
  Bitcoin Cash
  Polkadot
  NEAR Protocol
  Polygon
  Litecoin
  Uniswap
  LEO Token
  First Digital USD
  Hedera
  Aptos
Aptos  Stellar
  Filecoin
  Cosmos Hub
  Render
  OKB
OKB  Pepe
Pepe  Immutable
  dogwifhat
  XT.com
  Bittensor
  Arbitrum
  Maker
Maker  Wrapped eETH
  Optimism
  The Graph
