Join Our Telegram channel to stay up to date on breaking news coverage
The dYdX price prediction shows that DYDX could be ready for the uptrend as the trades near the $3.40 resistance today.
dYdX Prediction Statistics Data:
- dYdX price now – $3.37
- dYdX market cap – $629.5 million
- dYdX circulating supply – 183.7 million
- dYdX total supply – 1 billion
- dYdX CoinMarketCap ranking – #79
DYDX/USD Market
Key Levels:
Resistance levels: $4.00, $4.20, $4.40
Support levels: $2.50, $2.30, $2.10
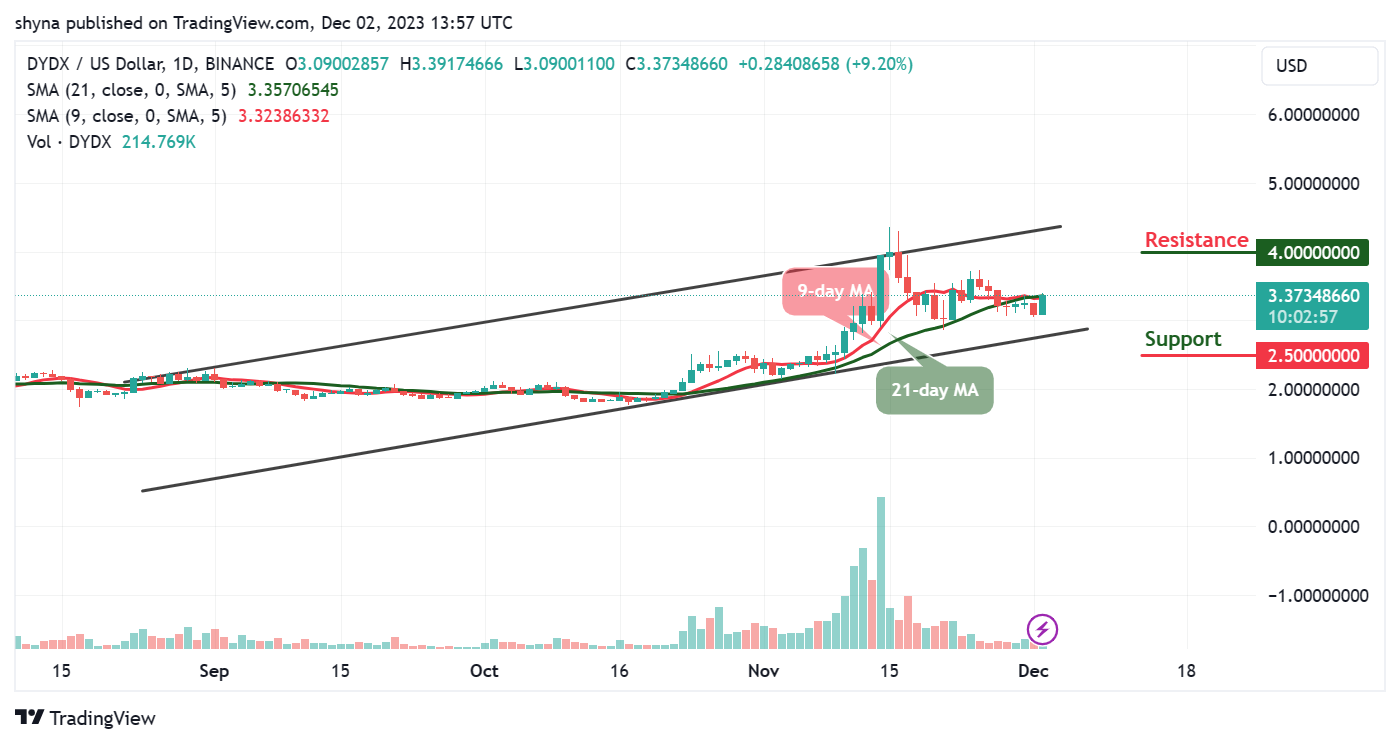
DYDX/USD is likely to cross above the resistance level of $3.50 to increase the bullish movement. Meanwhile, the cryptocurrency might kick-start another bullish run back above the $3.40 level if the market price trades near the upper boundary of the channel. Consequently, any additional positive break to the upside is needed for the coin to press higher. Nevertheless, DYDX/USD has to break above the $3.50 level before hitting the $3.80 resistance level.
dYdX Price Prediction: dYdX (DYDX) May Gain More Upsides
Looking at the daily chart, the dYdX price is currently above the 9-day and 21-day moving averages. If the buyers continue to grind higher, the first resistance level may be located at $3.40 as this could also be followed by $3.50. However, additional resistance levels may also be found at $4.00, $4.20, and $4.40 respectively. On the other side, if the DYdX price heads toward the channel, it could hit the first support level at $3.00.
However, any further bearish movement may lead the coin to the critical support levels at $2.50, $2.30, and $2.10. The 9-day MA may need to cross above the 21-day MA, which indicates that buyers may begin to gain control of the market, and this could also mean that DYDX/USD could be pushing toward the resistance level of $3.50 soon.
DYDX/BTC May Continue With Sideways Movement
Against Bitcoin, the daily chart shows that the dYdX price is attempting to cross above the 9-day and 21-day moving averages. As soon as the price stables above this barrier, there is a possibility that additional gains could be obtained. Therefore, the next resistance level is close to the 1000 SAT level. If the price keeps rising, it could even break the 1100 SAT and above.
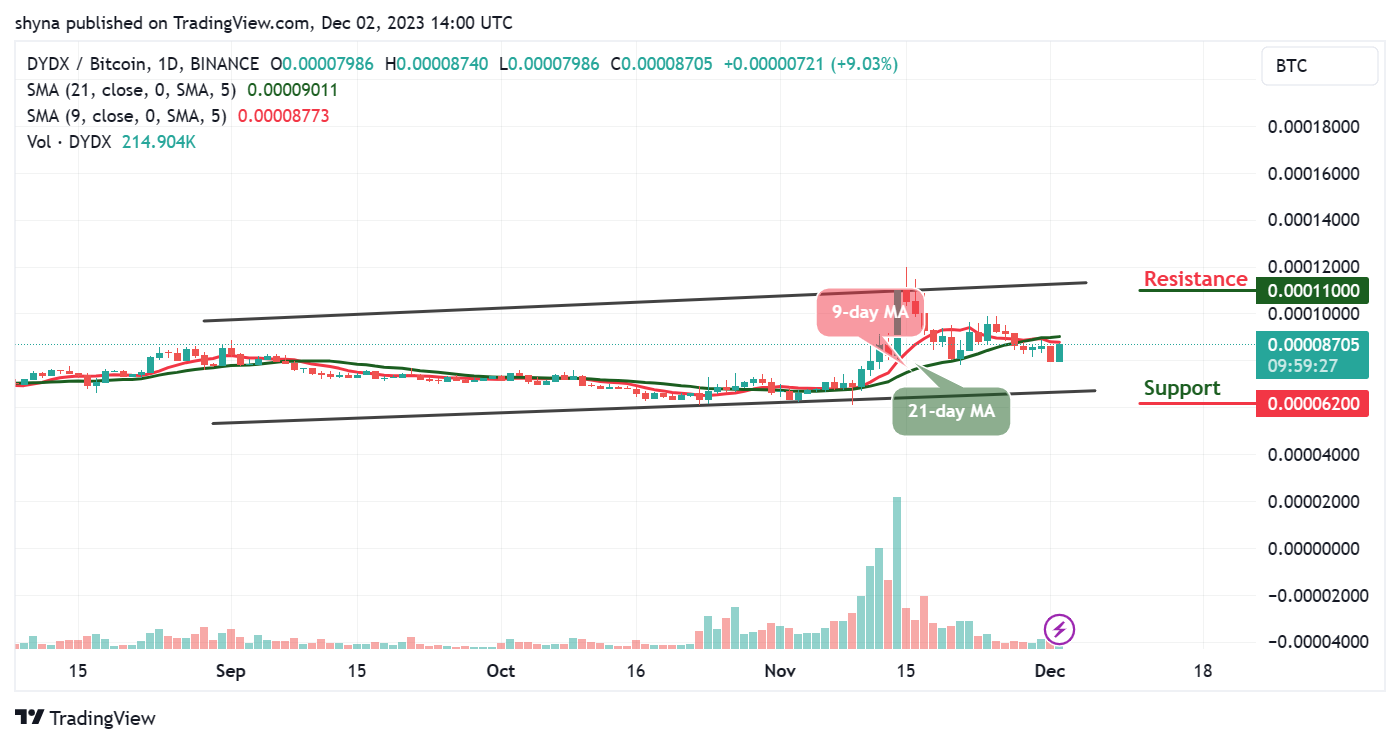
However, if the bears regroup slide below the lower boundary of the channel, 6500 SAT support may play out before rolling to critical support at 6200 SAT and below. Meanwhile, the 9-day MA remains below the 21-day MA, suggesting bearish movement within the channel.
Alternatives to dYdX
According to the daily chart, if buying pressure increases, the dYdX price is expected to surpass the 9-day and 21-day moving averages. Currently trading at $3.37, the bullish momentum suggests a continuation of upward movement. Traders can anticipate the coin reaching the upper channel boundary, targeting the nearest resistance level at $3.40. Meanwhile, traders are to keep an eye out for potential upward developments in the dYdX market.
In a surprising turn of events, Bitcoin Minetrix has emerged as a frontrunner in the cryptocurrency arena, thanks to its inventive cloud mining solution and an exceedingly prosperous presale. While dYdX (DYDX) charts an upward trajectory, all eyes are now fixed on Bitcoin Minetrix, speculating on its imminent ascent to prominence in the crypto sphere. Notably, the token has exceeded all predictions, amassing an impressive $4.6 million during its presale phase.
New Crypto Mining Platform – Bitcoin Minetrix

- Audited By Coinsult
- Decentralized, Secure Cloud Mining
- Earn Free Bitcoin Daily
- Native Token On Presale Now – BTCMTX
- Staking Rewards – Over 100% APY
Join Our Telegram channel to stay up to date on breaking news coverage
Credit: Source link


 Bitcoin
  Ethereum
  Tether
  BNB
BNB  Solana
  USDC
USDC  XRP
XRP  Dogecoin
  Toncoin
  Cardano
  Shiba Inu
  Avalanche
  Polkadot
  Wrapped Bitcoin
  Bitcoin Cash
  NEAR Protocol
  Polygon
  Litecoin
  LEO Token
  Uniswap
  First Digital USD
  Aptos
Aptos  Hedera
  Cosmos Hub
  Pepe
Pepe  Immutable
  Filecoin
  Stellar
  XT.com
  Render
  Optimism
  OKB
OKB  dogwifhat
  Arbitrum
  Bittensor
  Sui
Sui  Wrapped eETH
  Maker
Maker 
