
Join Our Telegram channel to stay up to date on breaking news coverage
The Enjin price prediction reveals that ENJ may continue to follow the bullish movement as the coin moves to cross above the channel.
Enjin Prediction Statistics Data:
- Enjin price now – $0.31
- Enjin market cap – $319 million
- Enjin circulating supply – 1 billion
- Enjin total supply – 1 billion
- Enjin Coinmarketcap ranking – #100
ENJ/USD Market
Key Levels:
Resistance levels: $0.40, $0.42, $0.44
Support levels: $0.23, $0.21, $0.19
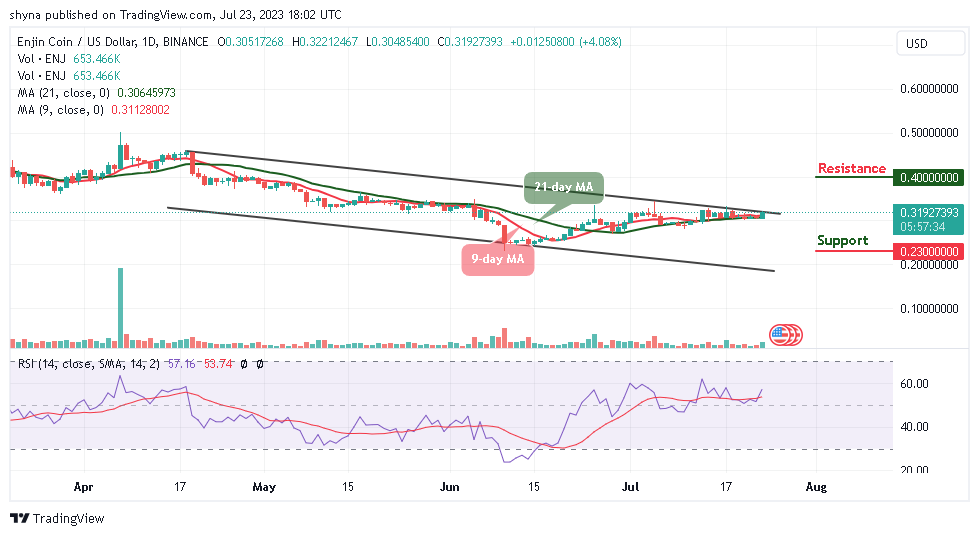
ENJ/USD is likely to hold gains above the support level of $0.30 as the price faces the resistance level of $0.35. At the time of writing, the Enjin price is recovering above $0.30 and the 9-day moving average remains above the 21-day moving average. Meanwhile, the Enjin price could start another decline unless it surpasses and stays above the main $0.35 resistance zone.
Enjin Price Prediction: Would Enjin Hold Above $0.32?
According to the daily chart, the Enjin price is currently hovering at the resistance level of $0.31 and the initial support could still be created below the previous low at $0.30. If the coin eliminated this level, the sell-off may begin with the next focus on the $0.25 level. Therefore, if this support level drops further, the downward momentum could begin to snowball, and the next closest supports may be located at $0.23, $0.21, and $0.19.
As the daily chart reveals, bulls must realize the need to cross above the upper boundary of the channel before they can get to the potential resistance levels. Above this handle, traders may need to consider a sustained move for the extended recovery to the resistance levels of $0.40, $0.42, and $0.44. Meanwhile, the technical indicator, the Relative Strength Index (14) faces the 60-level, which could give additional bullish signals, and this may be possible if the signal line crosses above this level.
Against BTC, buyers are making an effort to step back into the market as the Enjin price keeps showing some promising signs. On the upside, if the price crosses above the upper boundary of the channel, the nearest resistance level could be located at 1200 SAT and above.
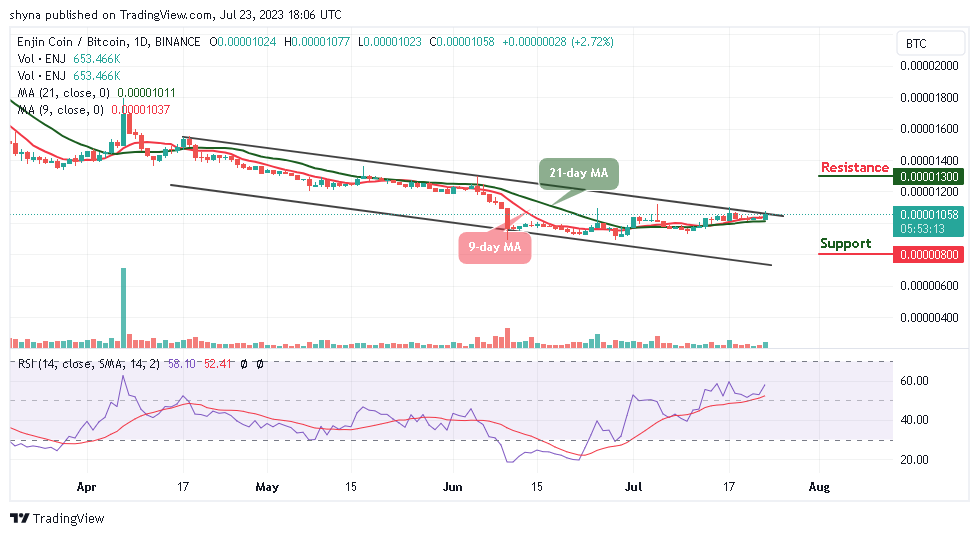
However, when looking from the downside, the nearest support level is below the moving averages at 850 SAT. Therefore, if the price drops further to create another low, lower support is located at 800 SAT and below. The Relative Strength Index (14) could move to cross above the 60-level which indicates that the market may follow the bullish movement.
Enjin Alternatives
Looking at the daily chart, the Enjin price is likely to trend to the upside and a bullish movement above the upper boundary of the channel could push the coin to the positive side. Meanwhile, the Orchid will have to keep the price above the moving averages in other to guide against the downward pressure.
On that note, given the sheer scale of the Wall Street Memes community, it’s no surprise that it has attracted attention from influential figures who recognize the power of meme-driven movements. Meanwhile, there has already been close to $17 million raised during the presale.
Wall Street Memes – Next Big Crypto

- Early Access Presale Live Now
- Established Community of Stocks & Crypto Traders
- Featured on BeInCrypto, Bitcoinist, Yahoo Finance
- Rated Best Crypto to Buy Now In Meme Coin Sector
- Team Behind OpenSea NFT Collection – Wall St Bulls
- Tweets Replied to by Elon Musk
Join Our Telegram channel to stay up to date on breaking news coverage
Credit: Source link


 Bitcoin
  Ethereum
  Tether
  BNB
BNB  Solana
  USDC
USDC  XRP
XRP  Dogecoin
  Toncoin
  Cardano
  Shiba Inu
  Avalanche
  Polkadot
  Wrapped Bitcoin
  Bitcoin Cash
  NEAR Protocol
  Polygon
  Litecoin
  Uniswap
  Fetch.ai
  LEO Token
  Hedera
  Aptos
Aptos  First Digital USD
  Cosmos Hub
  Pepe
Pepe  Filecoin
  Immutable
  Render
  Stellar
  dogwifhat
  XT.com
  OKB
OKB  Optimism
  Bittensor
  Arbitrum
  Maker
Maker  Wrapped eETH
  The Graph
