Ethereum Price Prediction – October 7
At the time of writing, the Ethereum price prediction shows that ETH must break and close back above the $3500 level for further upside.
ETH/USD Market
Key Levels:
Resistance levels: $4000, $4200, $4400
Support levels: $3000, $2800, $2600
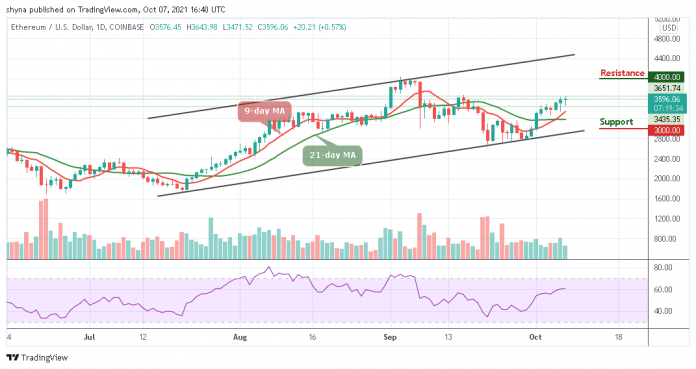
According to the daily chart, ETH/USD is seen trading at $3596 after recording an intraday high at $3643 during the European session today. Looking at the daily chart, Ethereum (ETH) has failed to follow in the footsteps of Bitcoin (BTC) as its margin of gains has been limited this time around. Actually, ETH/USD is still above the 9-day and 21-day moving averages after recovering from the daily low of $3471.
Ethereum Price Prediction: ETH Price May Spike to the Upside
Since the beginning of this month, today has been a day that the Ethereum price touches the monthly high of $3643 and the coin is expected to rise from this current high to $3800 in the next one-week reason been that the ongoing trend may move a little bit higher in the next positive movement. In the meantime, the Ethereum price may move towards the upper boundary of the channel to touch the nearest resistance at $3800.
Therefore, as the red-line of 9-day MA crosses above the green-line of 21-day MA, the coin may continue to do well and the price could hit the resistance levels at $4000, $4200, and $4400 respectively. Meanwhile, should the technical indicator makes a quick turn to the south, there may be a cross below 60-level and the bearish drop may likely roll the market down to the support levels of $3000, $2800, and $2600 as the Relative Strength Index (14) moves above 60-level.

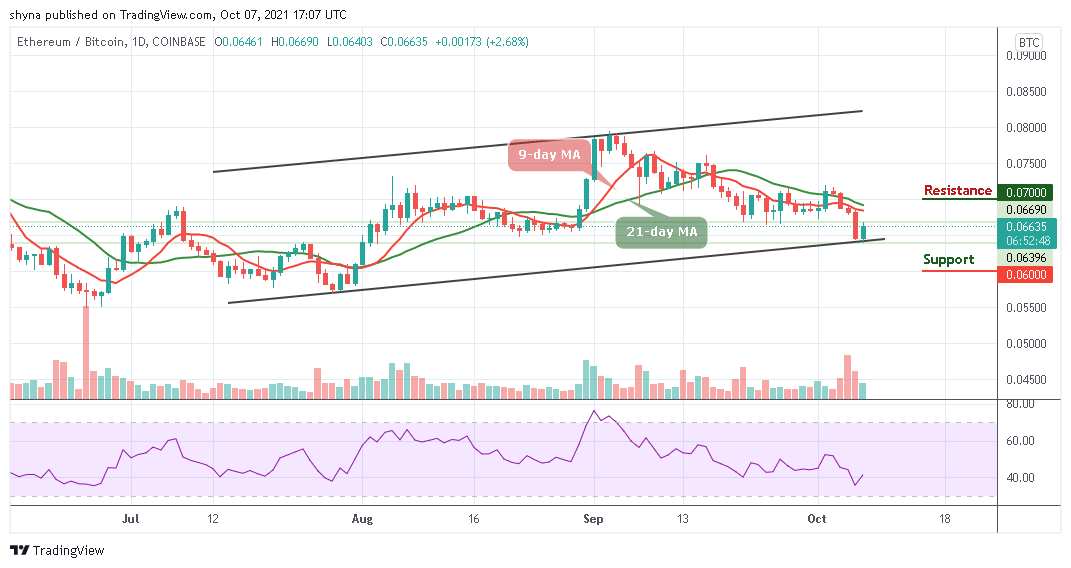
When compares with Bitcoin, as the red-line of 9-day MA is below the green-line of 21-day MA, the market price focuses on the downward movement within the channel. ETH/BTC is currently trading at the 6635 SAT and if the market continues to rise, the next key resistance may likely be at 7000 SAT and above.

On the downside, a possible bearish movement below the lower boundary of the channel may likely come into play and the support level of 6000 SAT and below could be visited. Meanwhile, the market may have a bullish day today because the Relative Strength Index (14) indicator moves above 40-level, suggesting more bullish signals.
Looking to buy or trade Ethereum (ETH) now? Invest at eToro!
67% of retail investor accounts lose money when trading CFDs with this provider
Read more:
Credit: Source link


 Bitcoin
  Ethereum
  Tether
  Solana
  USDC
USDC  XRP
XRP  Lido Staked Ether
  Dogecoin
  Toncoin
  Cardano
  Shiba Inu
  Avalanche
  TRON
TRON  Wrapped Bitcoin
  Polkadot
  Bitcoin Cash
  Chainlink
  NEAR Protocol
  Polygon
  Litecoin
  Fetch.ai
  Internet Computer
  Uniswap
  LEO Token
  Dai
Dai  Ethereum Classic
  Render
  Hedera
  First Digital USD
  Aptos
Aptos  Cosmos Hub
  Cronos
  Mantle
  Pepe
Pepe  Wrapped eETH
  Filecoin
  Stellar
  Stacks
  Immutable
  OKB
OKB  Renzo Restaked ETH
  dogwifhat
  Optimism
  Arbitrum
  Bittensor
  The Graph
  Maker
Maker 
