
Ethereum Price Prediction – March 31
The Ethereum price sits at a crucial support level that could determine where the coin will be heading in the next negative move.
ETH/USD Market
Key Levels:
Resistance levels: $3900, $4100, $4300
Support levels: $3000, $2800, $2600
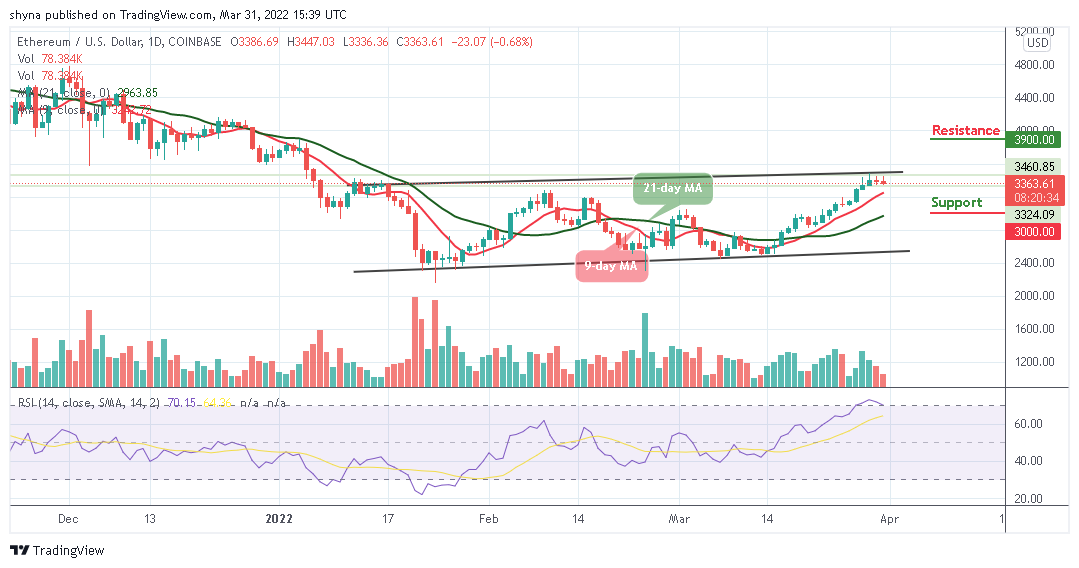
At the time of writing, ETH/USD follows in the footsteps of the flagship cryptocurrency as the coin is dropping towards the 9-day moving average. The Ethereum price failed to create a new high above the resistance level of $3400. However, if there is short-term selling pressure, Ethereum could most likely tackle it and make a comeback at the level mentioned above.
Ethereum Price Prediction: Can Ethereum (ETH) Go Lower?
According to the daily chart, the Ethereum price experiences a slight spike in profit-taking after creating a daily high of nearly $3500. However, the increasing selling pressure, therefore, brings the price to touch a new low at $3336. Meanwhile, as long as the red line of the 9-day moving average holds above the green line of the 21-day moving average, the Ethereum (ETH) could rebound towards the upper boundary of the channel.
In the meantime, if the buyers manage to maintain the bullish momentum, a slight upward movement could keep the Ethereum price above the moving averages as the coin may likely hit the resistance levels of $3900, $4100, and $4300 respectively. Therefore, any failure to stay above the moving averages could spell trouble for Ethereum (ETH).

From below, the downswing may trigger a sell-off below the 21-day moving average. As the Relative Strength Index (14) moves to cross below 70-level, it is likely for the Ethereum price to locate the supports at $3000, $2800, and $2600.
Against Bitcoin, the last few hours may reveal a bullish movement on the long channel and this reveals that the coin may cross above the upper boundary of the channel if the bulls put more effort. The Relative Strength Index (14) is now seen moving above 60-level, suggesting more bullish signals.
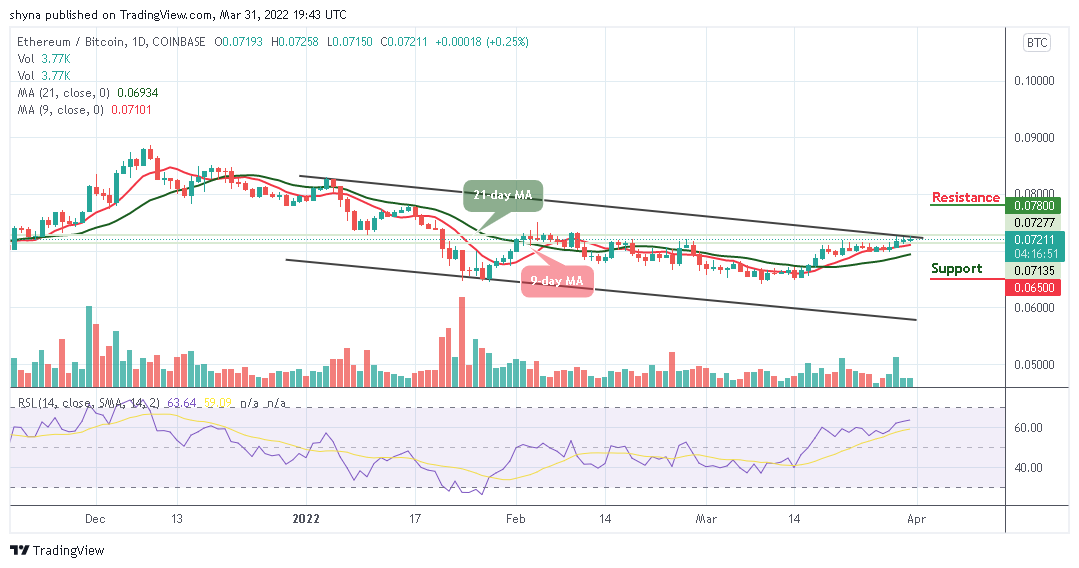
When observing the technical indicator, the Relative Strength Index (14) is heading to the upside, crossing above the channel can make the coin hit the resistance level of 7800 SAT but should in case the bulls failed to push ETH/BTC upward, sellers can use the opportunity to bring it to the support level of 6500 SAT and below.
Looking to buy or trade Ethereum (ETH) now? Invest at eToro!
68% of retail investor accounts lose money when trading CFDs with this provider
Credit: Source link


 Letter on Benefits and Challenges for Children in the Metaverse")


 Bitcoin
  Ethereum
  Tether
  BNB
BNB  Solana
  USDC
USDC  XRP
XRP  Dogecoin
  Toncoin
  Cardano
  Shiba Inu
  Avalanche
  Wrapped Bitcoin
  Bitcoin Cash
  Polkadot
  NEAR Protocol
  Polygon
  Litecoin
  Uniswap
  LEO Token
  First Digital USD
  Aptos
Aptos  Hedera
  Filecoin
  Stellar
  Cosmos Hub
  OKB
OKB  XT.com
  Render
  Pepe
Pepe  Immutable
  Arbitrum
  dogwifhat
  Wrapped eETH
  Bittensor
  Maker
Maker  Optimism
  Arweave
