Trade Intensifies Correction at $4,000– October 27
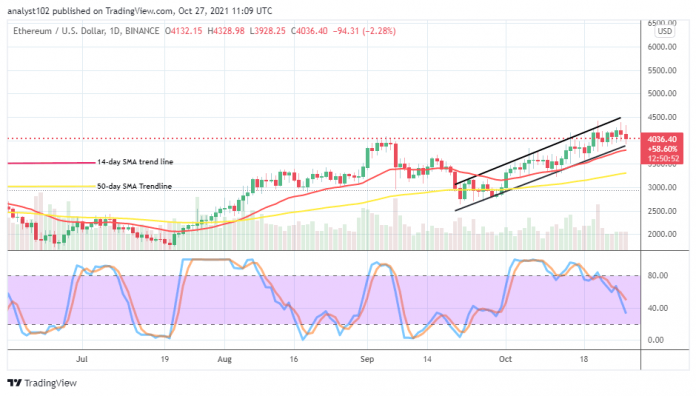
There have been long-term signs that the ETH/USD trade intensifies correction around the level of $4,000 as the crypto economy experiences trading at a negation percentage rate of 2.28. Currently, the market is at around $4,036 in operations.
Trade Intensifies Correction at $4,000: ETH Market
Key Levels:
Resistance levels: $4,500, $4,750, $5,000
Support levels: $3,750, $3,500, $3,250
The ETH/USD daily chart reveals that the crypto-economic trade intensifies correction around the level at $4,000. A bearish candlestick is in the making, signaling a slight-continued downward pressure toward the smaller SMA trend line. The 50-day SMA indicator is underneath the 14-day SMA indicator. The Stochastic Oscillators have bent southward against the range 40. That signifies that pressure is made against some support levels of the market.
Is there any possibility that the ETH/USD market could go down further as the crypto trade intensifies correction at $4,000?
A steady consolidation of the ETH/USD prices around $4,000 could lead to more downs as the crypto-economic trade intensifies correction around the value-line in the long-term runs of the business operations. That said, a sudden spike emerging around the point will give a nudge back in the market towards achieving some degrees of ups. Long position takers are required to be on the lookout while that trading scenario has to materialize.
On the downside, the ETH/USD market bears appear still enjoy pushes around the $4,000 level. And along consolidation movement may potentially allow the market gets downsize in the long run. In the meantime, the technical reading of the Stochastic Oscillators suggests the forces to the south side are gradually reducing. Therefore, getting more sell-orders may not come forth easily.
ETH/BTC Price Analysis
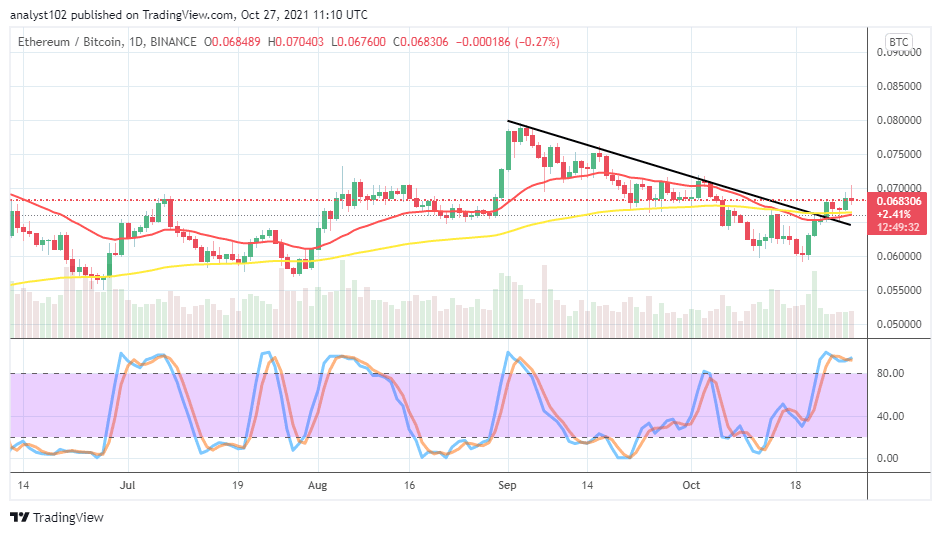
In comparison, Ethereum’s pushing capacity against Bitcoin has swung a bit higher to psychological trading zones that suggest a near probable loss of momentum by the base trading tool. In the wake of that sentiment playing out, the counter crypto could regain its momentum as paired with the base crypto, especially while a formation of bearish candlesticks appears against the SMA trend lines. The 14-day SMA indicator has tightly moved upward to the 50-day SMA indicator. The Stochastic Oscillators are in the oversold region with the lines conjoined. That indicates that the cryptocurrency pair market may witness low-active actions for a while.
Looking to buy or trade Ethereum (ETH) now? Invest at eToro!

68% of retail investor accounts lose money when trading CFDs with this provider.
Read more:
Credit: Source link


 Bitcoin
  Ethereum
  Tether
  Solana
  USDC
USDC  Lido Staked Ether
  XRP
XRP  Dogecoin
  Toncoin
  Cardano
  Shiba Inu
  Avalanche
  TRON
TRON  Wrapped Bitcoin
  Bitcoin Cash
  Polkadot
  Chainlink
  NEAR Protocol
  Polygon
  Internet Computer
  Litecoin
  Uniswap
  LEO Token
  Dai
Dai  First Digital USD
  Ethereum Classic
  Aptos
Aptos  Hedera
  Stacks
  Mantle
  Cronos
  Stellar
  Cosmos Hub
  Filecoin
  Renzo Restaked ETH
  Pepe
Pepe  OKB
OKB  Render
  Immutable
  XT.com
  Arbitrum
  Bittensor
  Maker
Maker  Optimism
  dogwifhat
  Wrapped eETH
  The Graph
