
Table of Contents
Bitcoin and its crypto counterparts kicked off the week with a bullish trend, propelled by the much-anticipated regulatory approval of a spot Bitcoin exchange-traded fund (ETF). The positive momentum carried over from the weekend, with Bitcoin reinforcing its dominance with a robust performance, as it witnessed a 1% increase, confidently maintaining its position above the 34,000-level mark.
Meanwhile, Ethereum experienced almost the same gains, hovering just above the $1,800 mark. The altcoin arena also joined the rally, with notable players like Litecoin (LTC), and Chainlink (LINK) all marking their presence with subtle yet noticeable upticks.
Despite the current upbeat atmosphere, the volatile nature of cryptocurrencies suggests that both bullish and bearish scenarios could unfold in the near future.
Ethereum (ETH) has showcased impressive performance, briefly touching $1,821 today and marking almost an 8% growth over the past week.
Source: CoinMarketCap
Positioned between $1,751 and $1,841, the asset seems to be in a crucial zone. Investors have witnessed a 14.5% rise in the past fortnight, and a remarkable 51% increase since the start of the year, positioning ETH as one of the top-performing major tokens in this timeframe.
However, in any technical analysis, it’s crucial to consider both sides of the coin. On the bullish side, if Ethereum (ETH) manages to sustain its current momentum and break through the $1,841 level, it might just set its sights on testing the next resistance at $1,871. This would align with the ongoing positive trend and could be supported by the increased investor positivity surrounding the crypto space.
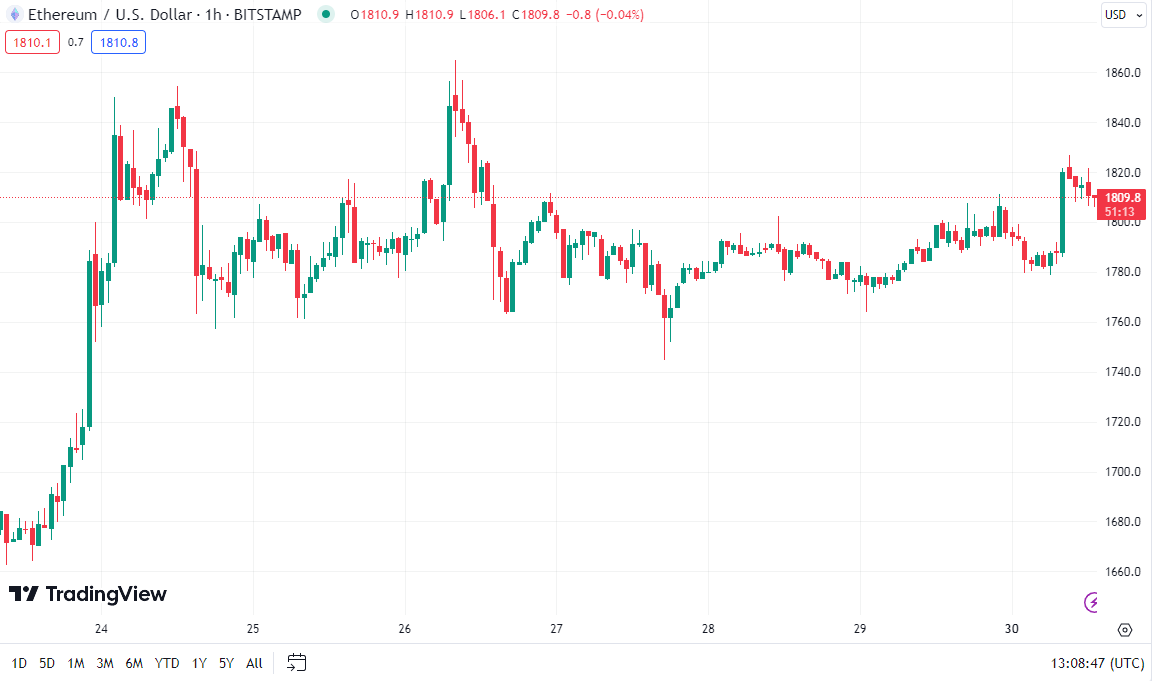
Source: TradingView
On the flip side, should ETH face selling pressure, it might test the first support at $1,751. A break below this level could lead to a further dip towards the second support point at $1,721, challenging the recent bullish momentum.
Currently, the technical indicators for Litecoin (LTC) paint a complex and precarious picture, oscillating between potential upward and downward movements. The cryptocurrency finds itself navigating between the price points of $65.3 and $70.36, with evident signs of market indecision showcased by the stagnation of the 3-10 day MACD oscillator at $69.07.
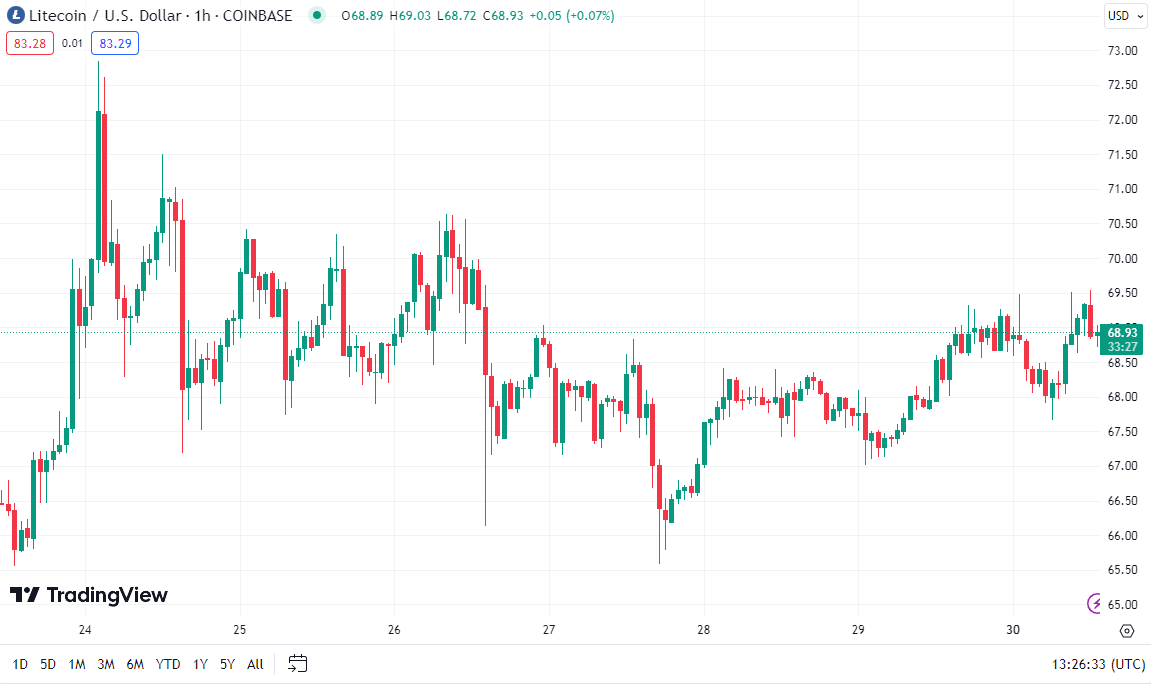
Source: TradingView
On the bullish side of the spectrum, if Litecoin (LTC) is able to maintain its position and push past the resistance at $70.36, it might aim for the $71.7 level, potentially bringing the 1-month high of $72.74 into play. The positive trajectory is further supported by the price’s recent crossover above the 9-day moving average, situated at $65.61, with a consistent hold above this mark serving as a bullish confirmation. Nevertheless, it’s crucial for traders to keep an eye on the 13-week high at $96.72, which stands as a formidable barrier of resistance.
On the flip side, there are discernible signs of exhaustion following the recent bullish phase of LTC, raising the possibility of a trend reversal. Should the market sentiment shift towards profit-taking, escalating into widespread selling, a significant price correction could be imminent. In such a bearish scenario, the support at $65.3 gains paramount importance. A drop below this level might lead Litecoin (LTC) to seek support at $63.96, and possibly further down at $62.1, aligning with the 1-month low of $59.86. This potential downturn demands vigilance from LTC holders, as it could swiftly negate the recent gains and inject volatility back into the market.
Chainlink (LINK) is grabbing headlines in the cryptocurrency world, largely thanks to the launch of Chainlink Staking Version 0.2 (v0.2). The lightning-fast embrace of its first version really showcased just how pumped and all-in the LINK crowd is, with investors jumping on board left and right. The set maximum pool size of 45 million LINK for staking further highlights the dedication of Chainlink (LINK) to enhancing its staking features.
Technically speaking, LINK is navigating through a pivotal zone, oscillating between the $10.758 and $11.871 levels. This range is crucial as it is likely to determine the short-term direction of Chainlink (LINK). A bullish momentum, possibly driven by the increased interest from the new staking update, could propel LINK past the $11.871 resistance. A breakthrough at this point may even challenge the 52-week high of $11.712, signifying a strong upward momentum.

Source: TradingView
However, the inherent volatility of the cryptocurrency market means that a bearish scenario is always lurking around the corner. Should Chainlink (LINK) experience a sell-off, breaking below the $10.758 support, it might find itself targeting lower levels such as $10.301 or even the $9.973 support in a more drastic bearish scenario.
Cryptocurrencies are on fire this week! Thanks to the buzz around the Bitcoin ETF, Bitcoin is looking solid, while Ethereum isn’t too far behind. And even the altcoin gang, featuring Litecoin (LTC) and Chainlink (LINK), are getting in on the action with some sweet gains.
ETH and LTC are sitting on a see-saw, and it could tip either way, with potential highs and lows waiting in the wings. And LINK – it’s in the spotlight with its latest staking news, surfing between crucial price points. There’s a lot of hype, but with crypto’s unpredictable nature, it could either ride the wave or wipeout.
So, as we navigate this week, we’re all on the edge of our seats. Will the good times roll on, or is there a twist in the tale? One thing’s for sure: the crypto drama never ends.
Disclaimer: This article is provided for informational purposes only. It is not offered or intended to be used as legal, tax, investment, financial, or other advice.
Credit: Source link


 Bitcoin
  Ethereum
  Tether
  BNB
BNB  Solana
  USDC
USDC  XRP
XRP  Dogecoin
  Toncoin
  Cardano
  Shiba Inu
  Avalanche
  Wrapped Bitcoin
  Bitcoin Cash
  Polkadot
  NEAR Protocol
  Polygon
  Litecoin
  Uniswap
  LEO Token
  First Digital USD
  Aptos
Aptos  Hedera
  Stellar
  Cosmos Hub
  Filecoin
  OKB
OKB  Render
  Immutable
  XT.com
  Pepe
Pepe  Arbitrum
  Bittensor
  dogwifhat
  Maker
Maker  Optimism
  Wrapped eETH
  The Graph
  Soars 13% Daily, Bitcoin Stopped at $29K (Market Watch)")
