
ETH Continues to Fall Aggressively – July 23
The Ethereum market rallies to a $1,500 higher point. Price has witnessed a high and a low of $4,891.70 and $0.4209 at a 1.61 percent rate positive.
Ethereum (ETH) Statistics:
ETH price now – $1,562.20
ETH market cap – $189.9 billion
ETH circulating supply – 121.7 million
ETH total supply – 121.7 million
Coinmarketcap ranking – #2
ETH Rallies to $1,500.: ETH Market
Key Levels:
Resistance levels: $1,750, $2,000, $2,250
Support levels: $1,250, $1,000, $750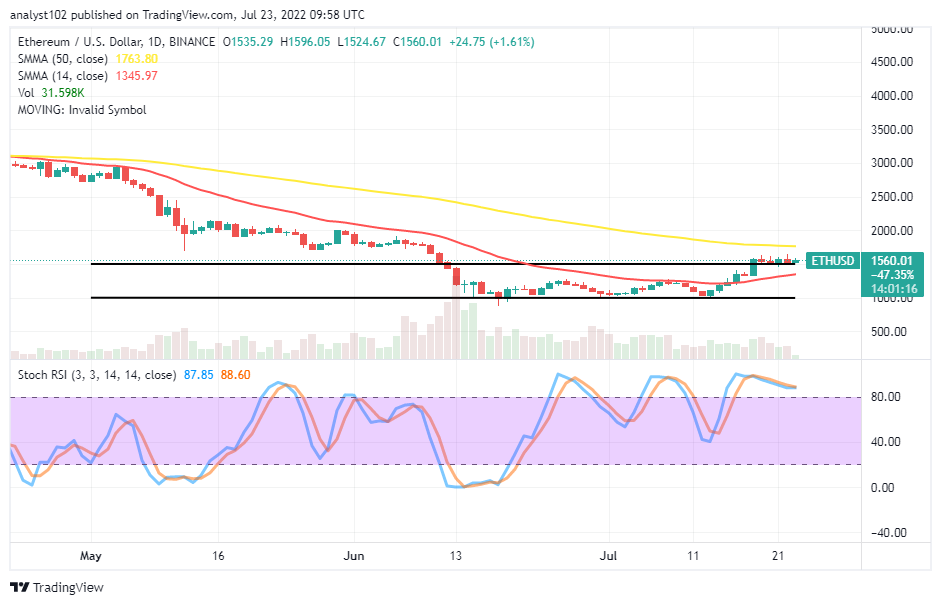 ETH/USD – Daily Chart
The daily chart showcases that the Ethereum market activity springs from a lower trading spot and rallies to a $1,500 higher level below the trend line of the bigger SMA. The 14-day SMA indicator is underneath the 50-day SMA indicator. The range-bound spots have expanded as the upper horizontal line drew at $1,500 and the lower horizontal line drawn at the support level of $1,000. The Stochastic Oscillators are in the overbought region. And they are now moving in a consolidation manner to denote a buying force is somewhat ongoing.
Will the ETH/USD market push sustainably over the $1,500 in the following session?
The ETH/USD market operation may have to witness a pit stop around the $1,500 level as the crypto economy rallies to the point. There have been some attempts made to surge briefly past it currently. But, they still seem lacking in strength around the value line. Long-position takers may now have to exercise caution as regards exerting new buying position orders as the market approaches a key resistance at $1,763.
On the downside of the technical analysis, the ETH/USD market bears have to reinforce efforts to forcibly push back the crypto’s valuation against the trend line of the 14-day SMA, which is at $1,345. In the process of that assumption playing out afterward, all the buying traits have to suspend for a while. In the .light of those analytics getting intensified, the price stands the possibility of revisiting its previous low trading zone.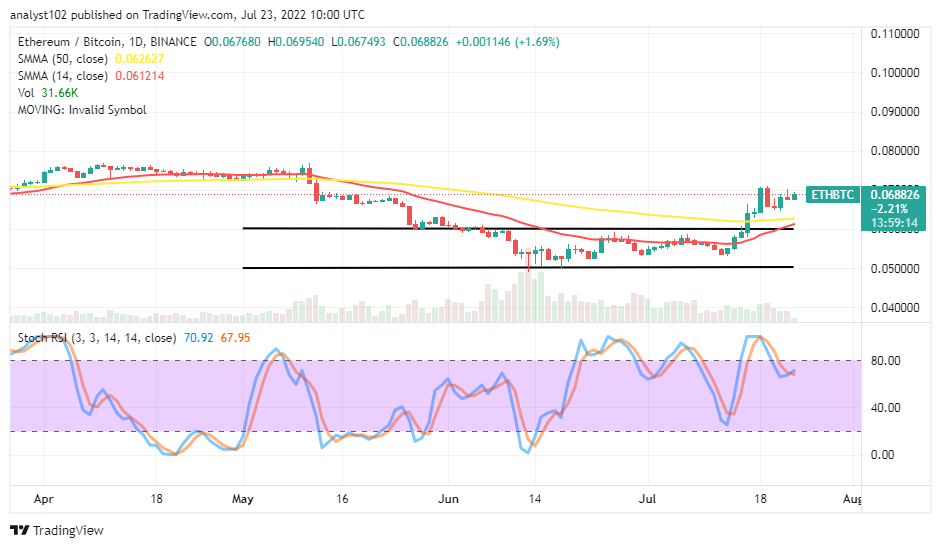
ETH/BTC Price Analysis
Ethereum has remained holding against the trending capacity of Bitcoin over the trend lines of the SMAs. The 14-day SMA indicator has closely bent northward beneath the 50-day SMA indicator. The price analysis chart showcases the cryptocurrency pair rallies to a high point, closely outside its range-bound spots. The Stochastic Oscillators have crossed southbound from the overbought region, trying to cross back northbound at 65 range. That means the base crypto may still somewhat push against its countering trading crypto for some time more.

Battle Infinity – New Crypto Presale
- Presale Until October 2022 – 16500 BNB Hard Cap
- First Fantasy Sports Metaverse Game
- Play to Earn Utility – IBAT Token
- Powered By Unreal Engine
- CoinSniper Verified, Solid Proof Audited
- Roadmap & Whitepaper at battleinfinity.io
Read more:
Credit: Source link


 Bitcoin
  Ethereum
  Tether
  BNB
BNB  Solana
  USDC
USDC  XRP
XRP  Dogecoin
  Toncoin
  Cardano
  Shiba Inu
  Avalanche
  Wrapped Bitcoin
  Bitcoin Cash
  Polkadot
  NEAR Protocol
  Polygon
  Litecoin
  Uniswap
  LEO Token
  First Digital USD
  Aptos
Aptos  Hedera
  Stellar
  Cosmos Hub
  Filecoin
  OKB
OKB  Immutable
  Pepe
Pepe  Render
  XT.com
  Arbitrum
  Bittensor
  Maker
Maker  Optimism
  dogwifhat
  Wrapped eETH
  The Graph
