
Join Our Telegram channel to stay up to date on breaking news coverage
The Hedera price prediction reveals that the slight bullish movement for Hedera (HBAR) is still intact as the coin aims at the $0.060 level.
Hedera Prediction Statistics Data:
- Hedera price now – $0.053
- Hedera market cap – $1.73 billion
- Hedera circulating supply – 32.5 billion
- Hedera total supply – 50 billion
- Hedera Coinmarketcap ranking – #32
HBAR/USD Market
Key Levels:
Resistance levels: $0.066, $0.068, $0.070
Support levels: $0.042, $0.038, $0.036
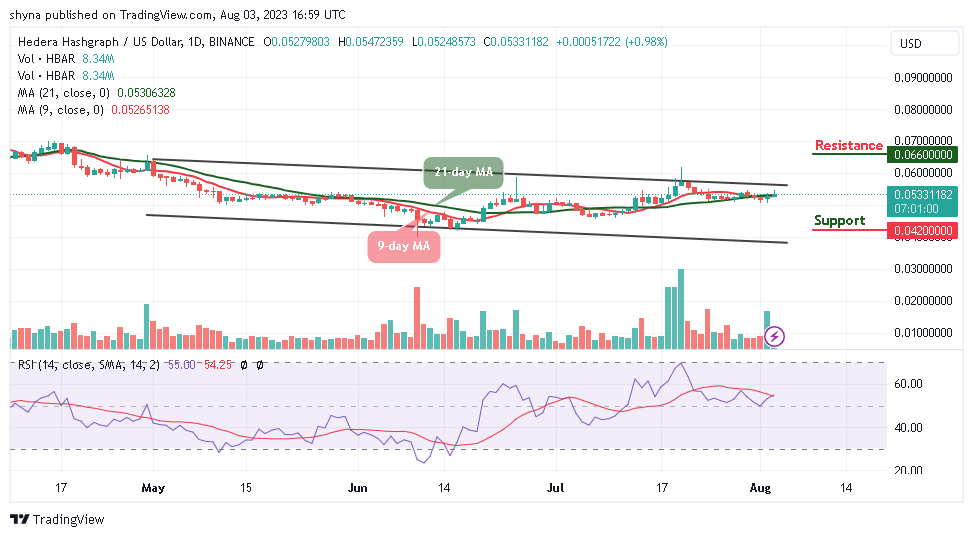
HBAR/USD is ranging within the 9-day and 21-day moving averages as the Hedera price hovers at $0.053 after touching the daily high of $0.054. However, an early trading session toward the $0.055 level failed to generate sustainable gains, but any further attempt may push the coin to cross above the upper boundary of the channel.
Hedera Price Prediction: Hedera (HBAR) Needs to Stay Above $0.053 Level
According to the daily chart, the longer the Hedera price fails to rally from current trading levels, the greater the chance that buyers may see the Hedera price falling toward the lower boundary of the channel. However, a break below the $0.050 level may provoke the current movement and cause the market to decline toward the $0.042, $0.038, and $0.036 support levels.
Nevertheless, the current movement reveals that the Hedera price may face upward movement if the 9-day MA crosses above the 21-day MA, and HBAR/USD may need to cross above the upper boundary of the channel which may cause the coin to reach the potential resistance levels of $0.066, $0.068, and $0.070. The technical indicator Relative Strength Index (14) is likely to cross above the 60-level, which shows that the market may still follow an upward movement.
Against Bitcoin, the Hedera price keeps hovering above the 9-day and 21-day moving average as the coin hovers at 183 SAT. However, the bullish structure may not come to play now but the Hedera (HBAR) may continue to move sideways or keep hovering above the moving averages if the technical indicator Relative Strength Index (14) crosses above the 60-level.
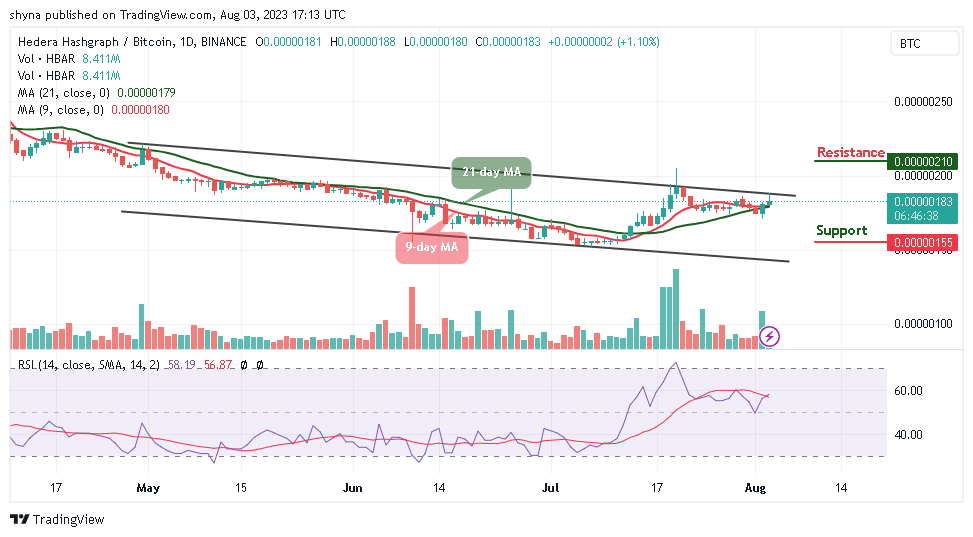
Therefore, until the price break above the channel, the direction of the trend may be ranging. Moreover, if the coin moves to the upside and crosses above the upper boundary of the channel, it could reach the potential resistance level of 210 SAT and above while the support level could be located at 155 SAT and below.
Alternatives to Hedera
The Hedera price is currently trading with a 0.98% slight gain, but the coin is yet to cross above the 9-day and 21-day moving averages. Meanwhile, the HBAR price may fight to stay above the important level of $0.055 so as to head toward the upper boundary of the channel.
Meanwhile, the new token in the market – Wall Street Memes has already a very large and strong community, it has a merch collection of caps, t-shirts, mugs, and sweatshirts, stepping into the world of crypto fashion and giving people the chance to show support for this movement with almost $21 million raised in the presale.
Wall Street Memes – Next Big Crypto

- Early Access Presale Live Now
- Established Community of Stocks & Crypto Traders
- Featured on BeInCrypto, Bitcoinist, Yahoo Finance
- Rated Best Crypto to Buy Now In Meme Coin Sector
- Team Behind OpenSea NFT Collection – Wall St Bulls
- Tweets Replied to by Elon Musk
Join Our Telegram channel to stay up to date on breaking news coverage
Credit: Source link


 Is Tipped to Edge Past Slow Market Movers Like Algorand (ALGO) and Fantom (FTM)")


 Outperforms Bitcoin and Dogecoin on This Front: Details")


 Bitcoin
  Ethereum
  Tether
  BNB
BNB  Solana
  USDC
USDC  XRP
XRP  Dogecoin
  Toncoin
  Cardano
  Avalanche
  Shiba Inu
  Wrapped Bitcoin
  Polkadot
  Bitcoin Cash
  NEAR Protocol
  Polygon
  Litecoin
  Fetch.ai
  Uniswap
  LEO Token
  Hedera
  Aptos
Aptos  First Digital USD
  Render
  Pepe
Pepe  Cosmos Hub
  dogwifhat
  Filecoin
  Immutable
  Stellar
  Wrapped eETH
  XT.com
  Bittensor
  OKB
OKB  Optimism
  Arbitrum
  The Graph
  Maker
Maker 
