
March witnessed a series of bank failures that have had ramifications for institutional crypto trading, putting a damper on what was once considered a bustling market space.
According to the latest insights from the blockchain intelligence platform Chainalysis, concerning North America, the fallout from these bank closures has been far-reaching, impacting the pace and volume of large-scale crypto transactions.
A Dip In Institutional Crypto Activity
Chainalysis’s recent report highlights the drop in “institutional” cryptocurrency transaction volume – transactions valued at more than $10 million. Starting in April 2023, the volume of these transactions plunged sharply, particularly in the North American region.
Interestingly, this downturn was specific to institutional transactions, as professional and retail trading volumes reportedly “remained constant.”
The report points directly to the banking crisis in March, which led to several major US bank shutdowns, including the “Silicon Valley Bank and the crypto-friendly banks Signature and Silvergate” as factors that resulted in this drop.
In addition, the failure of troubled digital currency exchanges and lending desks, such as FTX and Alameda Research, in the preceding November further exacerbated the decline, according to the Chainalysis report.
The Exodus Of Stablecoins From North America
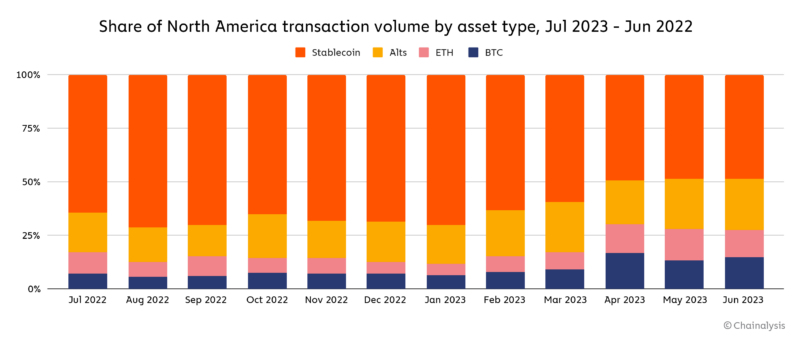
Furthermore, in the Chainlalysis report, one of the notable aftermaths of the banking crisis has been the dwindling dominance of stablecoins in North America. Stablecoins, primarily USD-pegged tokens, accounting for roughly 90% of global activity, began to lose ground in North America from February 2023 onwards.
Within a short span from February to June, the percentage of digital currency volume in the region attributable to stablecoins declined from 70.3% to 48.8%.
Chainalysis’s research further underscores that since the spring of 2023, there has been a noticeable shift of stablecoin inflows from US -US-licensed crypto services to their non-U.S. counterparts.
This shift denotes a broader migration pattern, with businesses and traders seeking financial shores beyond US jurisdictions. The report noted:
Since [the] spring of 2023, the majority of stablecoin inflows to the 50 biggest crypto services have shifted from US licensed-services to non-U.S. licensed services, undoing a shift in the opposite direction that occurred over the course of late 2022 and early 2023.
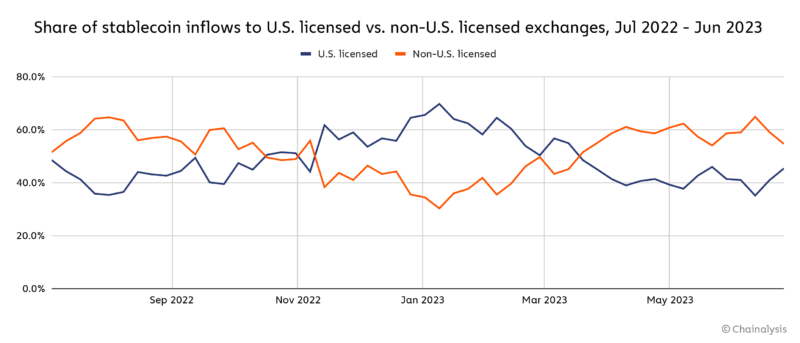
Chainalysis further disclosed that non-U.S. licensed platforms received 54.6% of stablecoin inflows among the top 50 services as of June.
Featured image from iStock, Chart from TradingView
Credit: Source link


")


")


 Bitcoin
  Ethereum
  Tether
  BNB
BNB  Solana
  USDC
USDC  XRP
XRP  Dogecoin
  Toncoin
  Cardano
  Shiba Inu
  Avalanche
  Wrapped Bitcoin
  Bitcoin Cash
  Polkadot
  NEAR Protocol
  Polygon
  Litecoin
  Uniswap
  LEO Token
  First Digital USD
  Aptos
Aptos  Hedera
  Stellar
  Filecoin
  Cosmos Hub
  OKB
OKB  Pepe
Pepe  XT.com
  Immutable
  Render
  Arbitrum
  Wrapped eETH
  dogwifhat
  Bittensor
  Optimism
  Maker
Maker  The Graph
