
Bitcoin price has written a red candle in the 1-week chart for the first time after five consecutive weeks. As NewsBTC reported, the price is in a critical zone in the 1-day chart to maintain the long-term uptrend. Therefore, the next few days could be of great importance to determine the trend.
Was $27,000 Already The Local Bottom For Bitcoin?
Co-founders of on-chain analytics solution Glassnode, Jan Happel and Yann Allemann, agree that the bulls remain in control, but need to slowly turn the tide. “Bitcoin’s long-term uptrend is intact,” they write, but point to weakened momentum due to low trading volume.
As Bitcoin currently hovers near support levels, smaller fluctuations of +/- $1k are anticipated, while moves between $27.5k and $32k would still be within the normal range as shown by the weekly volatility bands.
However, the analysts expect some wicks to the downside. In case of a sustained downside break, the next support area would be at $25,500 to $26,000 . But according to the analysts, the risk is rather low.
The Bitcoin risk signal is at 0 and looks a bit shaky in the short term despite the recent volatility, but is not indicating any panic selling. The Fear and Greed Index has pulled back from the greed zone to a neutral position at 52 points. Moreover, the analysts argue for a healthy correction in the market:
The current market environment, characterized by unrealized profits outpacing unrealized losses (see NUPL on glassnode), implies optimism in the medium and long term.
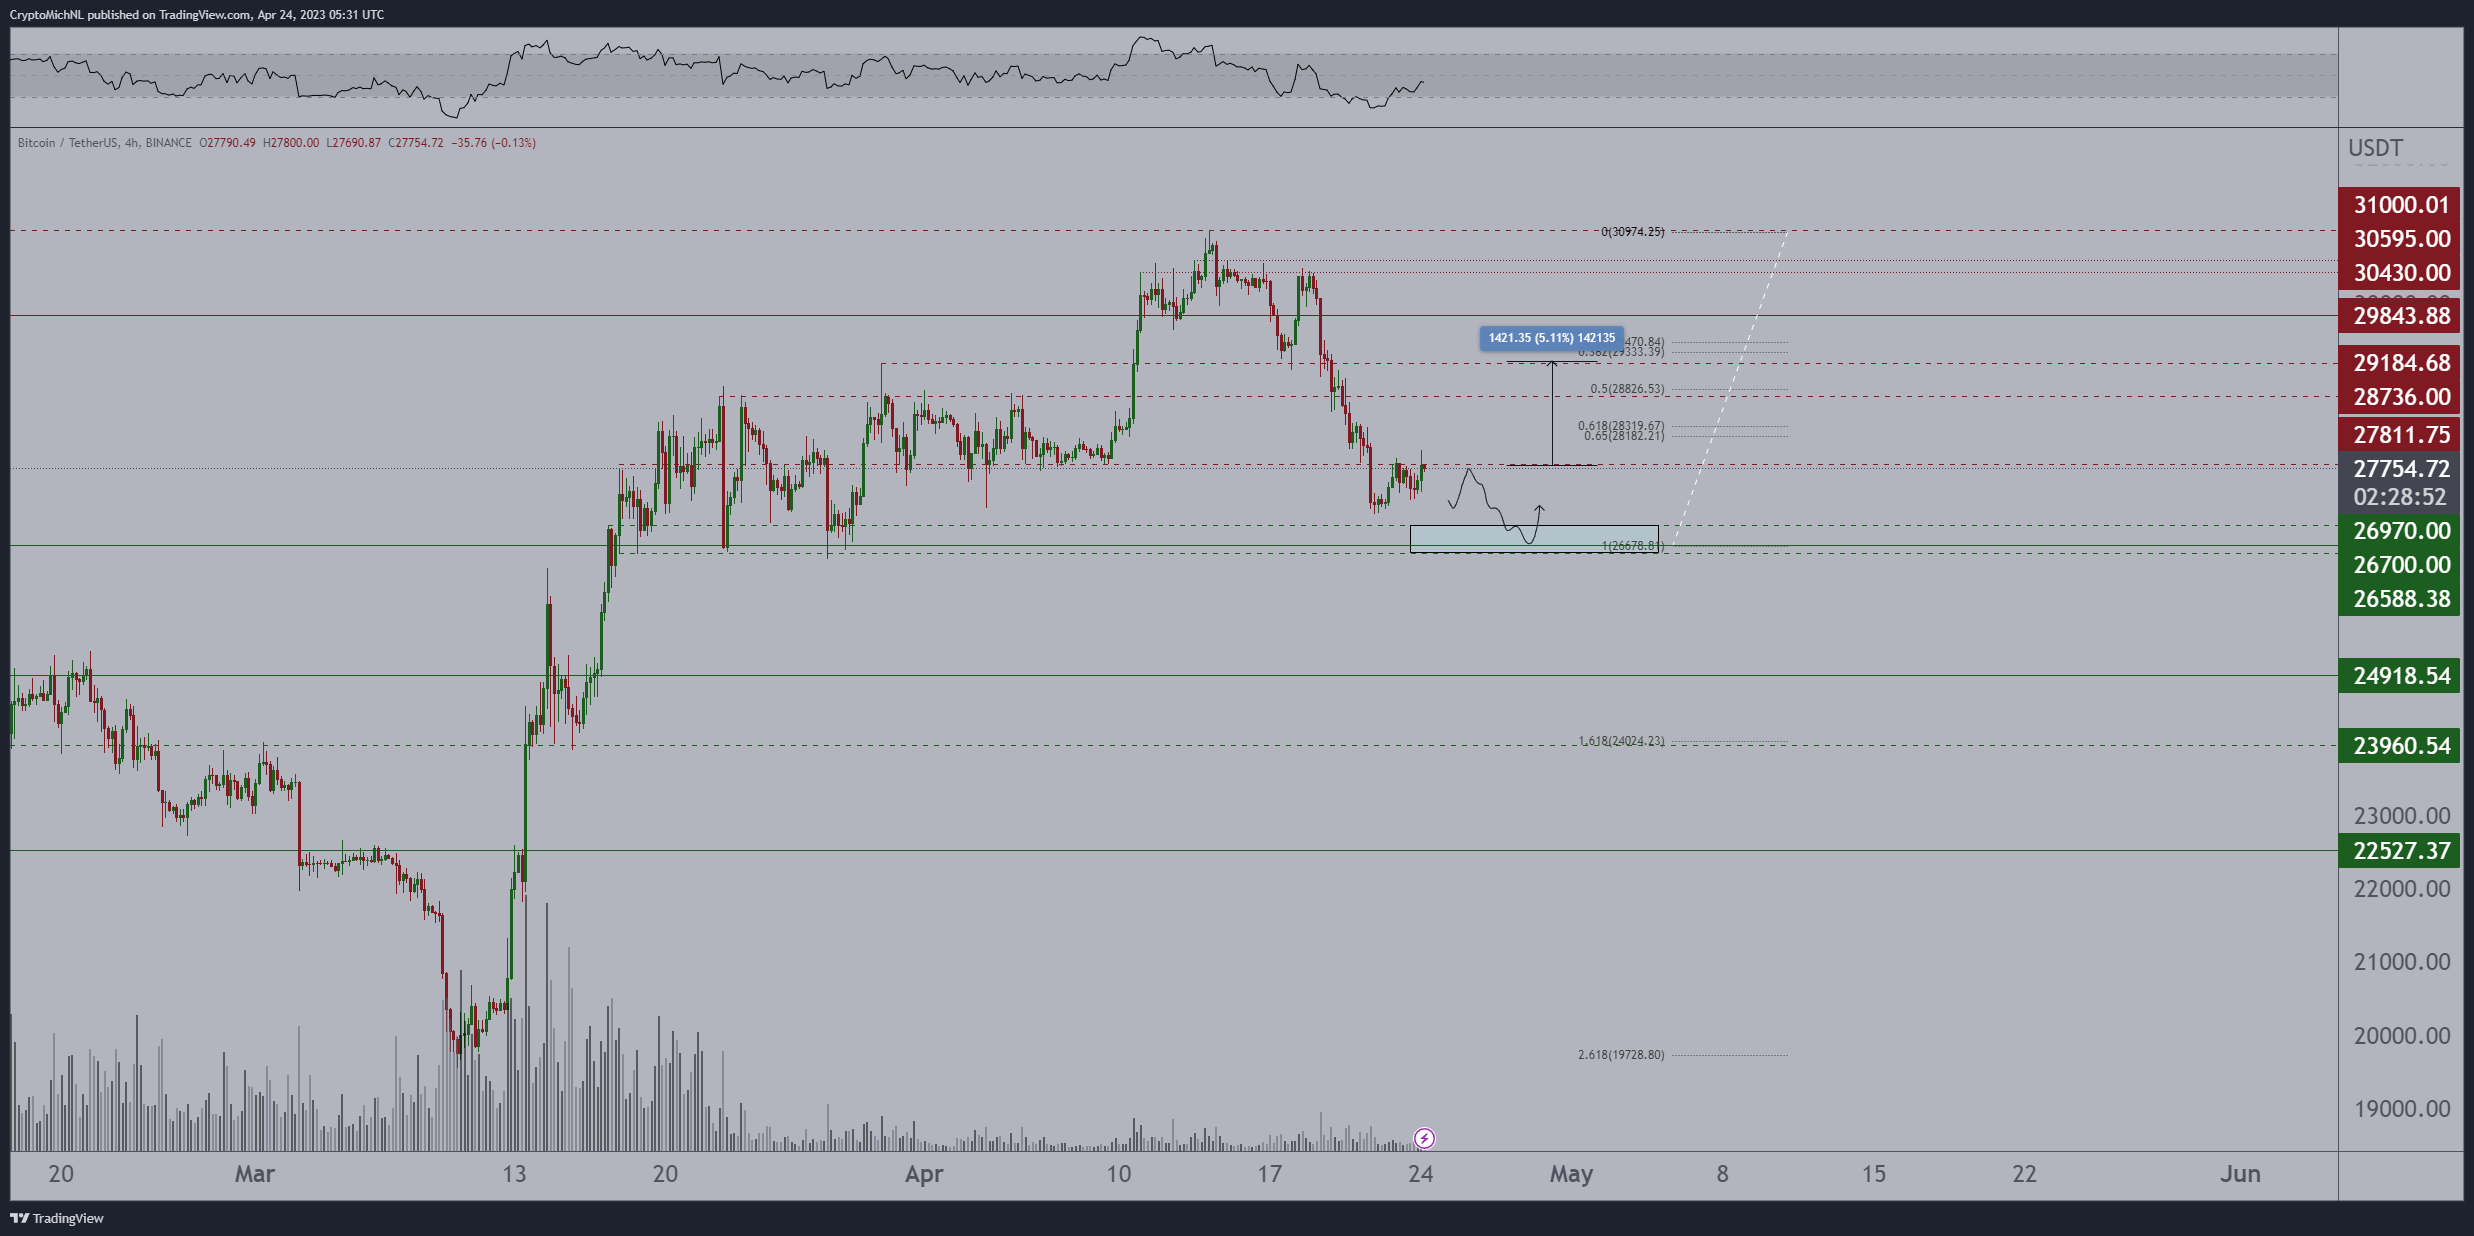
Technical analyst Michaël van de Poppe expects that there will be a “classic Monday drop” before there is a reversal. Bullish events this week could be the release of the U.S. Gross Domestic Product for the first quarter (Thursday) and the release of the Core PCE (Friday).
Crucial for a reversal, according to the analyst, is the price level at $27,800. “Divs in $26,800 area for longs on Bitcoin,” notes the analyst, who also explained:
Correction as CME gap came in for Bitcoin. Back towards the resistance, for the second time. If Bitcoin breaks $27,800-28,000 entirely in the coming few days, acceleration towards $29,200 seems next. Funding negative on ETH, so a bounce is getting close.
The renowned trader @exitpumpBTC takes a similar stance: “Want to see manipulation like Monday dump, consolidation with shorts piling up at the lows around $26K and Tuesday recovery with limit chasing by buyer.”
Analyst Ali Martinez shared the legendary “Wall Street Cheat Sheet” on the usual path of market cycles. Traders should ask themselves, how are you feeling today?
How are you feeling today about #crypto? pic.twitter.com/nnXj9wgyMZ
— Ali (@ali_charts) April 23, 2023
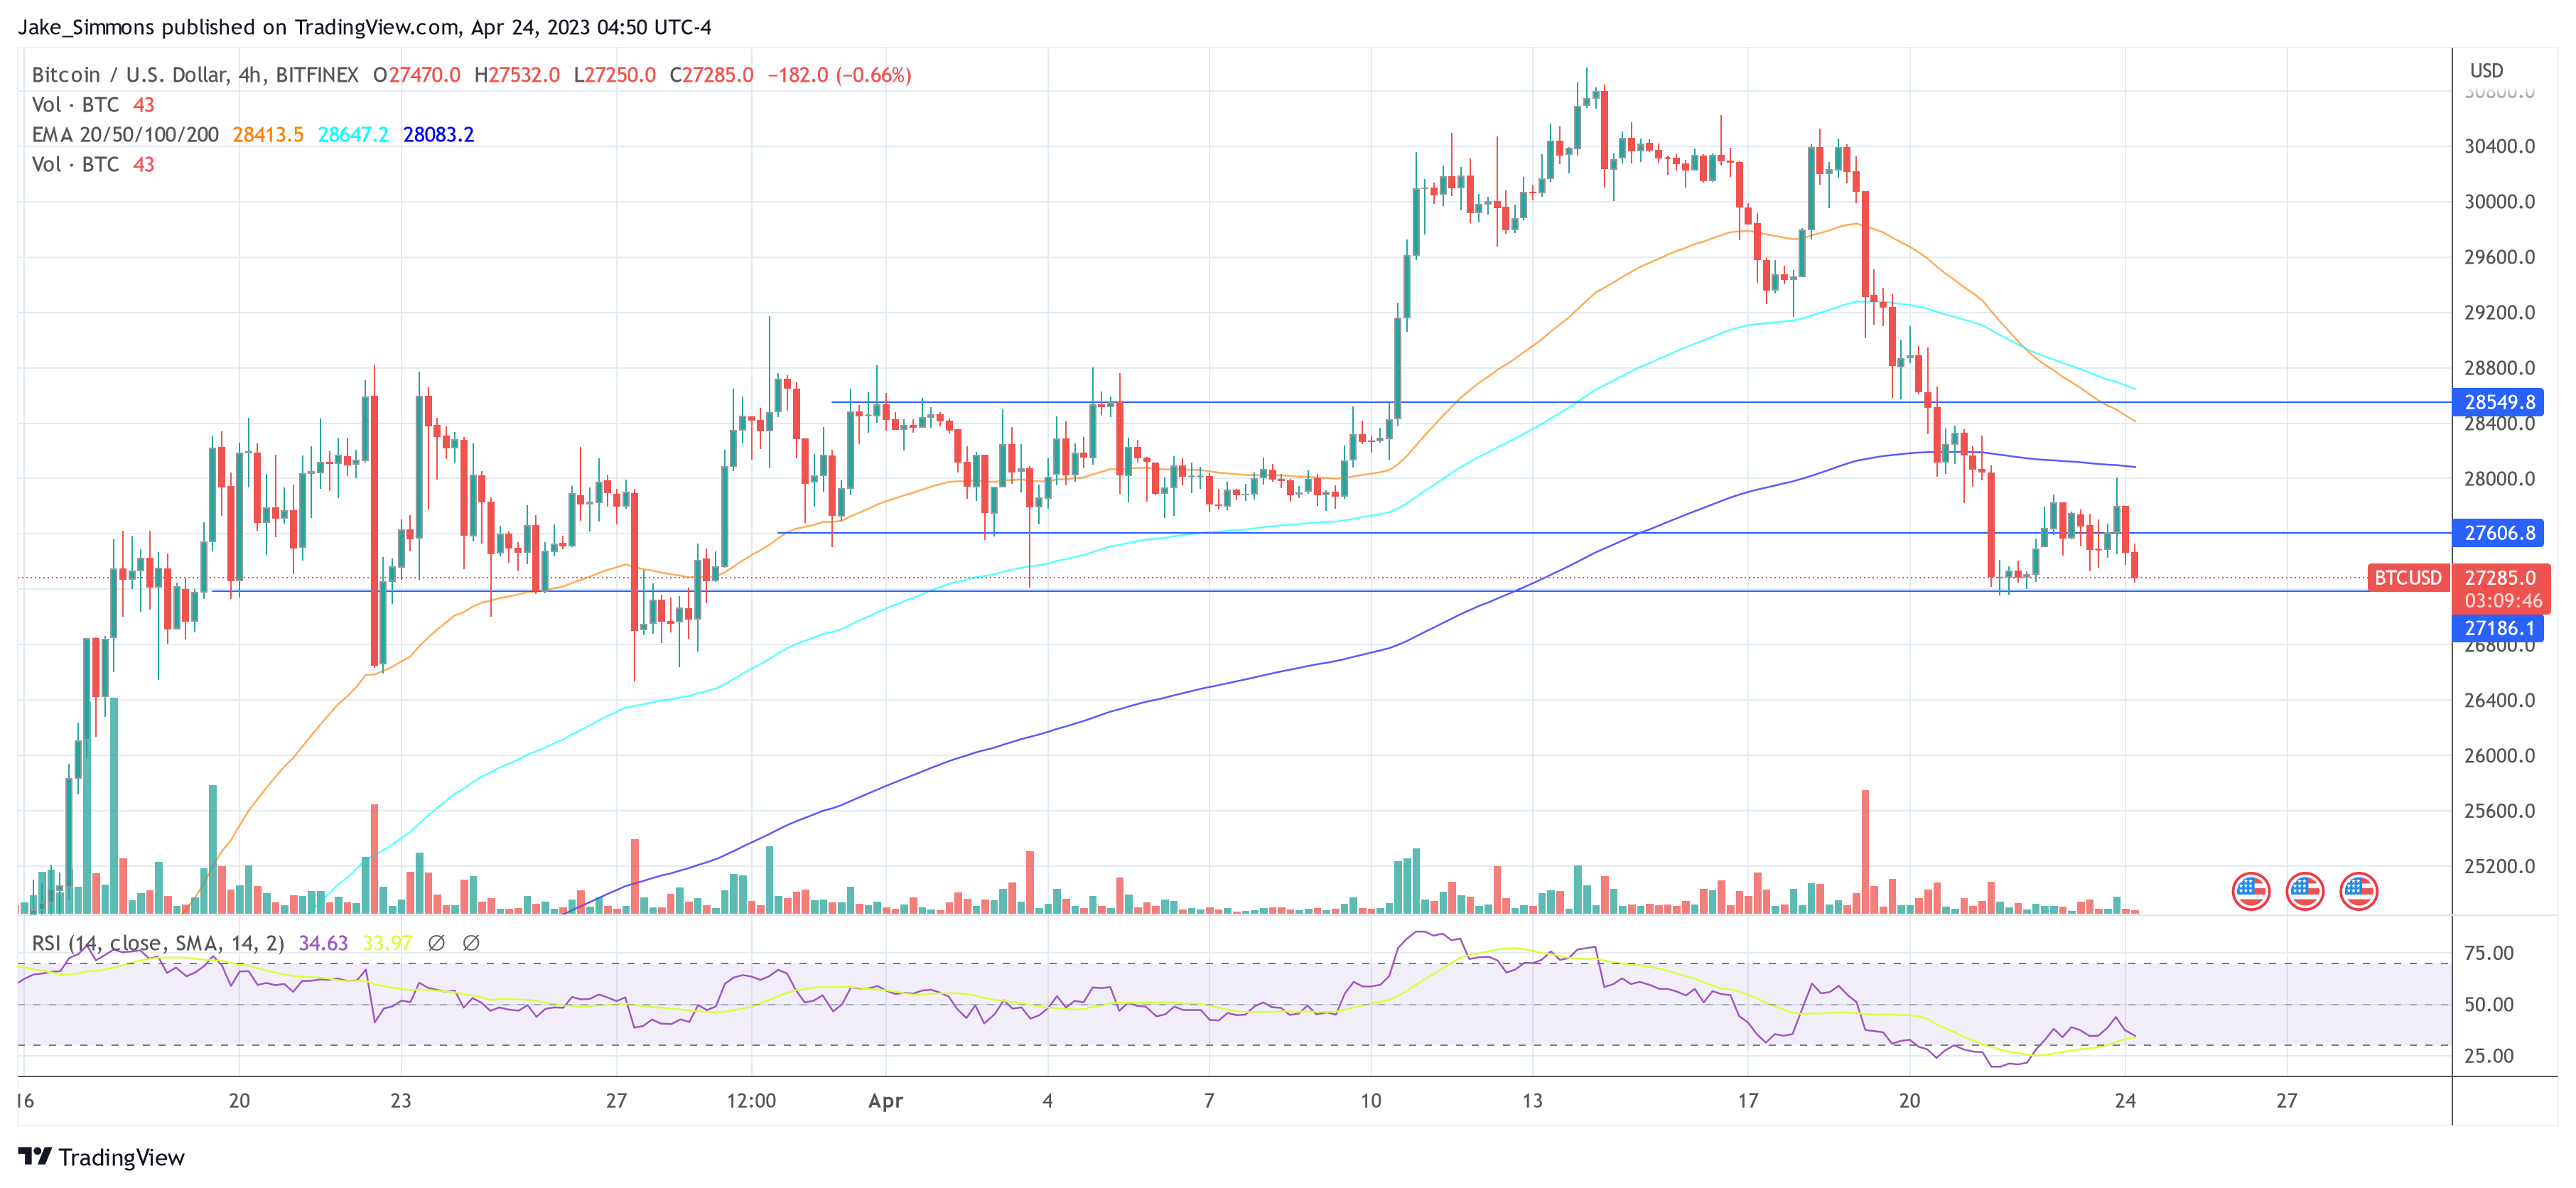
At press time, the BTC price traded at $27,285.
Featured image from: iStock, chart from TradinView.com
Credit: Source link


 at Token Sale and Made $1,400,000 Profit Believes This Coin Priced Below $0.05 Will Be the ‘Next Big Thing’ in the Crypto Market, Here's Why")


 Bitcoin
  Ethereum
  Tether
  BNB
BNB  Solana
  USDC
USDC  XRP
XRP  Dogecoin
  Toncoin
  Cardano
  Shiba Inu
  Avalanche
  Wrapped Bitcoin
  Bitcoin Cash
  Polkadot
  NEAR Protocol
  Polygon
  Litecoin
  Uniswap
  LEO Token
  First Digital USD
  Aptos
Aptos  Hedera
  Stellar
  Filecoin
  Cosmos Hub
  OKB
OKB  Render
  Immutable
  Pepe
Pepe  XT.com
  Arbitrum
  Bittensor
  Maker
Maker  Optimism
  dogwifhat
  Wrapped eETH
  The Graph
