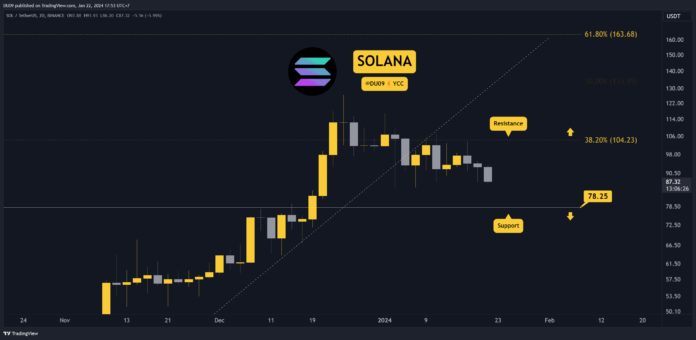
Solana’s selloff is intensifying. This puts the uptrend in question, and many are wondering when the bulls will come back into town.
Key Support levels: $78
Key Resistance levels: $104
1. Bears Dominate
Solana’s price fell by 7% in the past 24h and appears that it may make a lower low. This could see it reach the key support at $78, which is the first line of defense for bulls at this time.
2. Bearish Momentum Intensifies
Unfortunately, buyers were unable to stop this decline, and the selling momentum has intensified in the past few days. This is also reflected in the momentum indicators, such as the MACD and RSI, which are making lower lows.
3. MACD Lower Lows
The 3-day MACD histogram is making lower lows, and the moving averages are expanding as they fall. This is bearish, and a recovery seems unlikely now.
Bias
The bias for SOL is bearish.
Short-Term Prediction for SOL Price
The most important level on the chart is the support at $78. It’s interesting to see if the bears will be able to take it down there.
Binance Free $100 (Exclusive): Use this link to register and receive $100 free and 10% off fees on Binance Futures first month (terms).
Disclaimer: Information found on CryptoPotato is those of writers quoted. It does not represent the opinions of CryptoPotato on whether to buy, sell, or hold any investments. You are advised to conduct your own research before making any investment decisions. Use provided information at your own risk. See Disclaimer for more information.
Cryptocurrency charts by TradingView.
Credit: Source link


 Bitcoin
  Ethereum
  Tether
  Solana
  USDC
USDC  XRP
XRP  Lido Staked Ether
  Dogecoin
  Toncoin
  Cardano
  Avalanche
  Shiba Inu
  TRON
TRON  Wrapped Bitcoin
  Polkadot
  Bitcoin Cash
  Chainlink
  NEAR Protocol
  Polygon
  Litecoin
  Internet Computer
  Fetch.ai
  Uniswap
  LEO Token
  Dai
Dai  Hedera
  Ethereum Classic
  Aptos
Aptos  First Digital USD
  Render
  Cosmos Hub
  Pepe
Pepe  Cronos
  Mantle
  dogwifhat
  Filecoin
  Stellar
  Stacks
  Immutable
  XT.com
  Wrapped eETH
  OKB
OKB  Renzo Restaked ETH
  Bittensor
  Optimism
  Arbitrum
  The Graph
  Maker
Maker 
