
The Lightning Network, a second-layer (L2) solution built atop the Bitcoin blockchain, has drastically changed the way the crypto market perceives transaction speeds and costs.
Designed to address the scalability issues of Bitcoin, it facilitates instant, low-cost transactions by creating off-chain payment channels. This solution ensures that not every transaction must be recorded on the main blockchain, significantly reducing congestion and fees.
However, estimating the exact number and volume of transactions on the Lightning Network is a complex endeavor. The network architecture inherently makes it challenging for external observers to determine the precise transaction count. This is primarily because a significant portion of direct (between two nodes) and private transactions remain undisclosed for privacy reasons. Without comprehensive data from a vast majority of nodes, it’s nearly impossible to provide an accurate upper bound of transactions on the network.
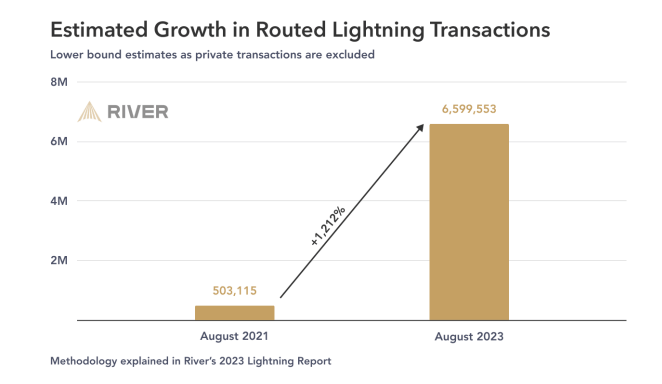
To gauge the transaction metrics, River analyzed data from nodes representing 52% of the public capacity on the Lightning Network. Based on this data, it’s estimated that there were around 6.6 million routed transactions on the Lightning Network in August 2023. This represents a staggering 1,212% increase from the August 2021 estimated 503k transactions.
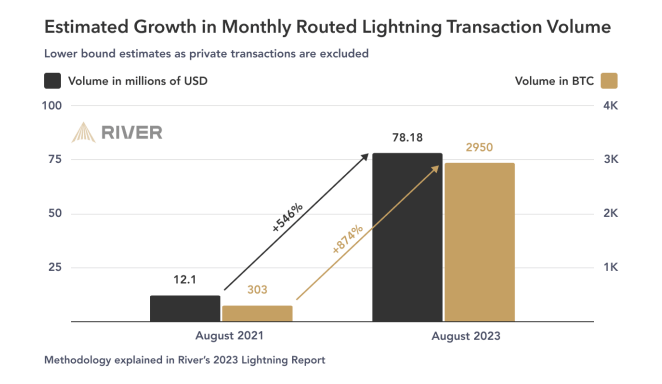
In terms of volume, approximately $78.2 million (equivalent to 2,950 BTC) was publicly routed on the network in August 2023, marking a 546% rise from the August 2021 estimate of $12.1 million.
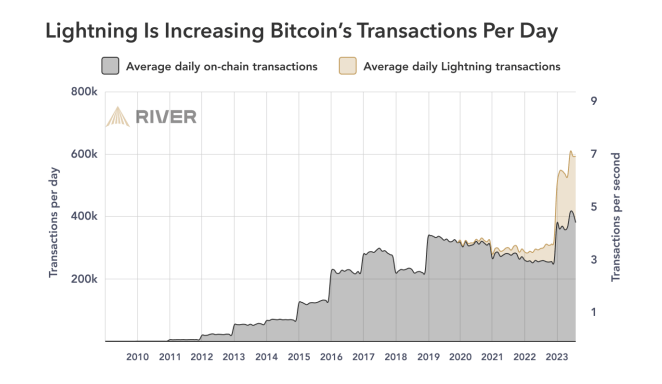
These numbers are significant for several reasons. Firstly, they underscore the growing adoption and trust in the Lightning Network’s capabilities. The exponential growth in transactions and volume, even amidst a 44% Bitcoin price drop, indicates that users are increasingly leveraging the network for its efficiency and cost-effectiveness. Secondly, when juxtaposed with Bitcoin’s on-chain transactions, the Lightning Network already exhibits a higher velocity, suggesting that it’s facilitating a more rapid exchange of value in the ecosystem.
For the market, these metrics indicate a maturing and robust second-layer solution that successfully addresses Bitcoin’s scalability issues. The surge in transactions and volume underscores the network’s potential to handle a substantial portion of global microtransactions, further solidifying Bitcoin’s position as a store of value and a medium of exchange.
The post Lightning Network transactions increased by 1,212% in two years appeared first on CryptoSlate.
Credit: Source link


 Reach the Highs of Shiba Inu (SHIB) and Chainlink (LINK)?")


 Bitcoin
  Ethereum
  Tether
  BNB
BNB  Solana
  USDC
USDC  XRP
XRP  Dogecoin
  Toncoin
  Cardano
  Shiba Inu
  Avalanche
  Polkadot
  Wrapped Bitcoin
  Bitcoin Cash
  Polygon
  NEAR Protocol
  Litecoin
  LEO Token
  Uniswap
  First Digital USD
  Aptos
Aptos  Hedera
  Cosmos Hub
  Immutable
  Filecoin
  Pepe
Pepe  Stellar
  XT.com
  Optimism
  Render
  OKB
OKB  dogwifhat
  Arbitrum
  Bittensor
  Wrapped eETH
  Sui
Sui  Maker
Maker 
