
Litecoin Market Activity Converges at Higher Zones – November 14
The LTC/USD market activity converges around higher zones while the crypto-economic price has surged northwardly. The trade now prices around $254 level at a percentage rate of about 1.13 negative. That reveals that the base trading tool is somewhat relaxing in its momentums.
Market Activity Converges at Higher Zones: LTC Trade
Key Levels:
Resistance levels: $275, $300, $325
Support levels: $225, $200, $175
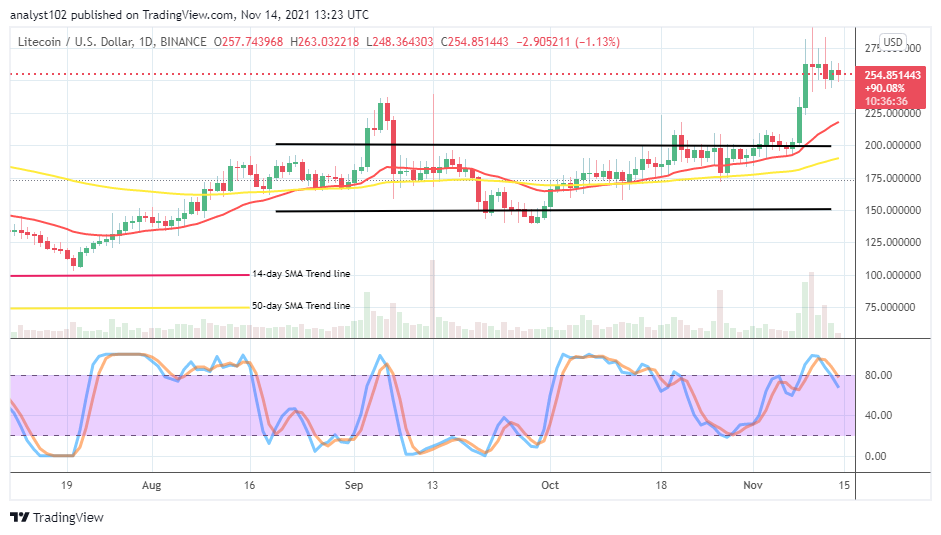
LTC/USD – Daily Chart
The LTC/USD daily chart exhibits that the crypto market activity converges at higher zones of $275 and $250. The 50-day SMA trend line is in the range-bound levels of $200 and $175 underneath the 14-day SMA trend line that is located out of those value lines. The current trading zones are above the indicators. The Stochastic Oscillators have slightly crossed the lines from the overbought region against the range of 80 to indicate that a downward movement may soon show up in the market.
What are those trading points necessary to look out for as the LTC/USD market activity converges at higher zones?
Traders may have to be on the lookout for what could be the subsequent crypto trade reactions around $250 and $200. It would be of a technical inclination that buyers allow price to move down to find support before going for a long entry as the LTC/USD market activity converges at higher zones. The lower level around the smaller value-line earlier mentioned could now be a good spot around, which the market aims to re-settle to make a supportive baseline after a while.
On the downside, all seem to get set for the LTC/USD market sellers to make re-launches of sell positions, as it has indicated that the crypto economy currently experiences a line of variant convergences at higher trading zones. The market value line at $250 appears to be the vital point that price needed to push against to the south direction to confirm the potency that the market will go under afterward.
LTC/BTC Price Analysis
In comparison, Litecoin’s s trending capacity has gained much strength against Bitcoin in the last couple of days’ sessions. The cryptocurrency pair market activity converges at higher zones above the trading indicators. The 14-day SMA trend line has bent northward closely beneath the 50-day SMA trend line. The Stochastic Oscillators have crossed the lines to reach the range of 80. That signifies that the base crypto stands to lose part of its capacity to counter crypto in the near time.
Looking to buy or trade Litecoin (LTC) now? Invest at eToro!
68% of retail investor accounts lose money when trading CFDs with this provider.

Read more:
Credit: Source link


")


 Bitcoin
  Ethereum
  Tether
  BNB
BNB  Solana
  USDC
USDC  XRP
XRP  Dogecoin
  Toncoin
  Cardano
  Shiba Inu
  Avalanche
  Wrapped Bitcoin
  Bitcoin Cash
  Polkadot
  NEAR Protocol
  Polygon
  Litecoin
  Uniswap
  LEO Token
  First Digital USD
  Hedera
  Aptos
Aptos  Stellar
  Cosmos Hub
  Filecoin
  OKB
OKB  Render
  Immutable
  XT.com
  Pepe
Pepe  Arbitrum
  Bittensor
  Maker
Maker  dogwifhat
  Wrapped eETH
  The Graph
  Optimism