
Litecoin Market Holds Along the Upper Bearish Channel – December 28
The LTC/USD market holds along the upper bearish channel to connote a declining motion that is somewhat prevailing in the crypto trading activities. The market possesses the percentage rate relatively in declination to showcase that the crypto’s price is on the note of downing.
Market Holds Along the Upper Bearish Channel: LTC Trade
Key Levels:
Resistance levels: $175, $200, $225
Support levels: $125, $115, $105
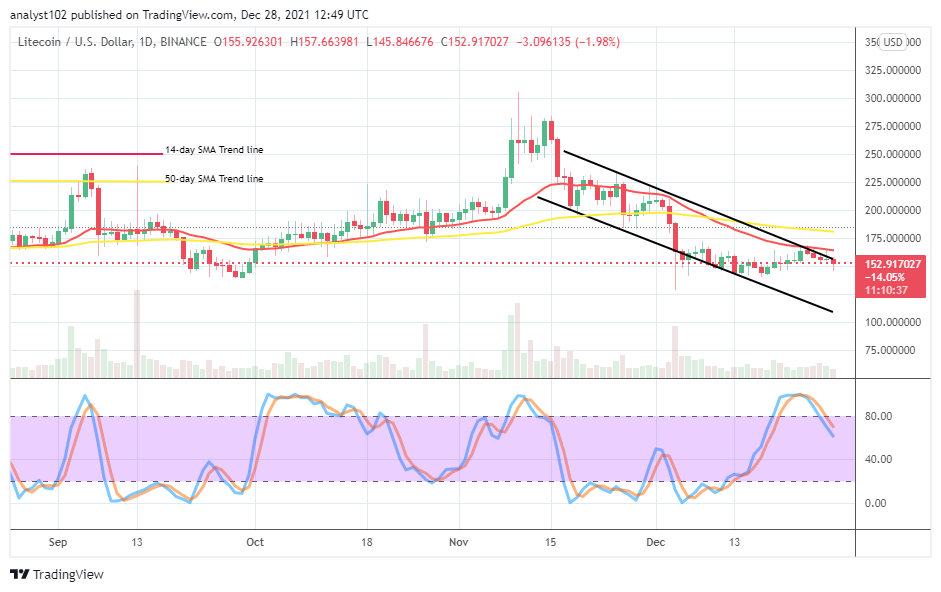
LTC/USD – Daily Chart
The LTC/USD daily chart exhibits that the crypto-economic market holds along the upper bearish channel. Variant smaller bearish candlesticks have been occurring in a sequential order downward alongside the upper bearish channel trend line drawn. The 14-day SMA indicator is below the 50-day SMA indicator. And they are above the current trading zone. The Stochastic Oscillators have crossed the range of 80 from the overbought region to indicate that the crypto economy would be experiencing a fall in its valuation.
Will the LTC/USD trade succumb further to depression as the market holds along the upper bearish channel?
The LTC/USD trade succumbing further to depression would have to be that buyers will be losing momentums at the $150 trading capacity level as the crypto market holds along the upper bearish channel trend line. The current trading atmosphere suggests that price tends to move downward in any systemic format until a session before any upswing can resurface. The downward force may not sustainably push beyond the support level of $125 in the long run.
The downside technical analysis, the LTC/USD market sellers have to hold their stances firm underneath the resistance trading level of $175. The breaking of the $150 to the downside, may in most cases, allow short-position takers to profit on a lighter and quicker note as there can be a rebound in no time against the value line. Therefore, traders needed to be cautious of exerting selling orders around that point.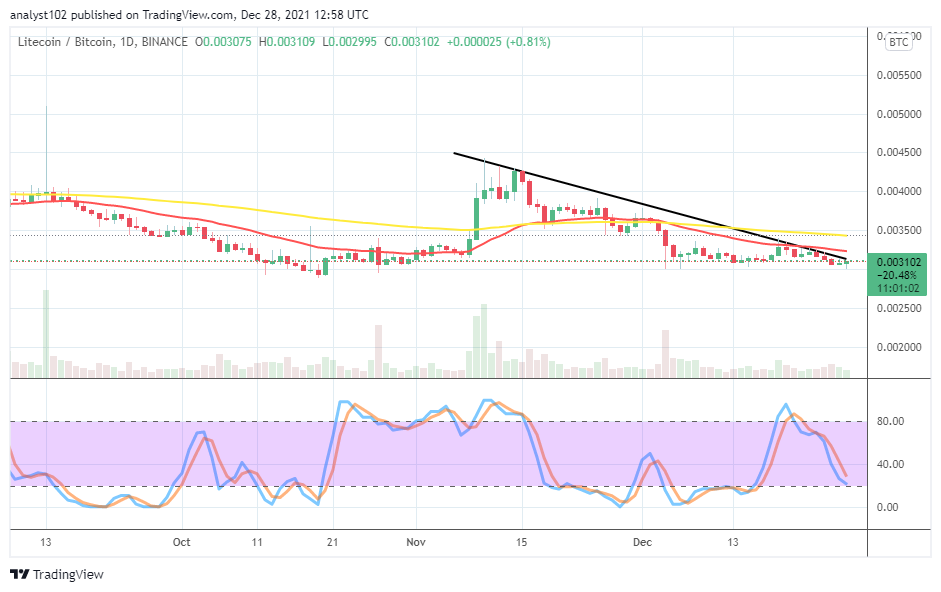
LTC/BTC Price Analysis
In comparison, Litecoin’s pushing weight yets wallows in depressions as paired with Bitcoin on the daily price analysis chart. The 14-day SMA trend line is underneath the 50-day SMA trend line. The bearish trend line drew downward across the SMAs. The Stochastic Oscillators have moved southbound closer to the range of 20. That indicates that the base crypto is still on the course of losing momentums trading against the counter crypto.
Looking to buy or trade Bitcoin (BTC) now? Invest at eToro!
68% of retail investor accounts lose money when trading CFDs with this provider.

Read more:
Credit: Source link


 Bitcoin
  Ethereum
  Tether
  BNB
BNB  Solana
  USDC
USDC  XRP
XRP  Dogecoin
  Toncoin
  Cardano
  Shiba Inu
  Avalanche
  Wrapped Bitcoin
  Polkadot
  Bitcoin Cash
  NEAR Protocol
  Polygon
  Litecoin
  Uniswap
  Fetch.ai
  LEO Token
  Hedera
  Aptos
Aptos  First Digital USD
  Pepe
Pepe  Cosmos Hub
  Filecoin
  dogwifhat
  Immutable
  Stellar
  Render
  XT.com
  OKB
OKB  Optimism
  Bittensor
  Arbitrum
  Maker
Maker  Wrapped eETH
  The Graph