
Litecoin Price Prediction – January 1
The Litecoin price prediction could set a bullish run if the market can make an attempt to climb back above the resistance level of $150.
LTC/USD Market
Key Levels:
Resistance levels: $180, $190, $200
Support levels: $120, $110, $100
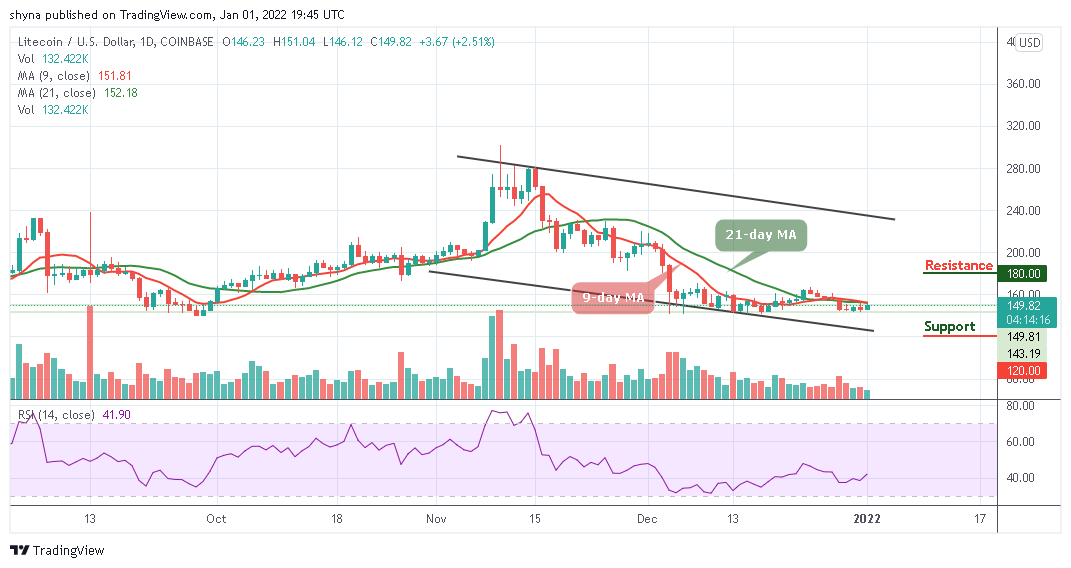
LTCUSD – Daily Chart
According to the daily chart, LTC/USD is running a little retracement move towards $150 with a price growth of 2.51%. For the fact that the coin is recording a slight gain, the Litecoin price may begin to maintain a bullish movement within the channel if the coin can crosses above the 9-day and 21-day moving averages. Therefore, traders can expect the price to continue to rise as soon as the bulls put more pressure on the market.
Litecoin Price Prediction: Litecoin (LTC) May Consolidate to the Upside
At the time of writing, the Litecoin price is seen hovering at $149.82. If the Litecoin price crosses above the 9-day and 21-day moving averages, the market price may rises toward the upper boundary of the channel. However, traders can then expect a bullish continuation and as the technical indicator Relative Strength Index (14) reveals, the signal line is seen moving above 40-level, the possible resistance levels could be located at $180, $190, and $200 respectively.
However, if the coin moves in the positive direction, the market may witness more of higher levels. At the time of writing, the Litecoin price is currently moving sideways in the short term. On the contrary, any bearish movement towards the lower boundary of the channel could roll the coin back to the long-term support at $120, $110, and $100 levels.

Against Bitcoin, the Litecoin price continues to follow sideways movement within the 9-day and 21-day moving averages. Meanwhile, in case of a trend reversal, there is a need for an increasing volume and resistance to cause an upsurge in the market, if not, the market may continue to range-bound. At the moment, the Litecoin (LTC) is hovering at 3165 SAT. Therefore, traders can expect close support at 2700 SAT and below.
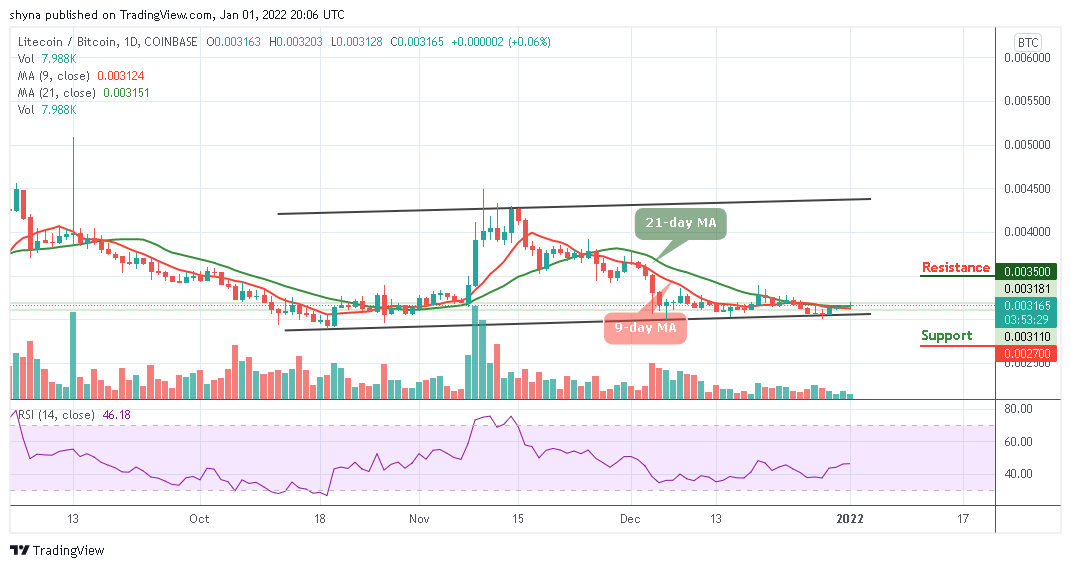
LTCBTC – Daily Chart
However, if the buyers push the Litecoin price to the upside, it may likely hit the nearest resistance level of 3300 SAT; traders can then confirm a bull-run for the coin. Moreover, the potential resistance could then be located at 3500 SAT and above as the technical indicator Relative Strength Index (14) moves above 45-level.
Looking to buy or trade Litecoin (LTC) now? Invest at eToro!
68% of retail investor accounts lose money when trading CFDs with this provider
Credit: Source link


 Bitcoin
  Ethereum
  Tether
  BNB
BNB  Solana
  USDC
USDC  XRP
XRP  Dogecoin
  Toncoin
  Cardano
  Shiba Inu
  Avalanche
  Polkadot
  Wrapped Bitcoin
  Bitcoin Cash
  NEAR Protocol
  Polygon
  Litecoin
  Uniswap
  LEO Token
  Fetch.ai
  Hedera
  Aptos
Aptos  First Digital USD
  Cosmos Hub
  Pepe
Pepe  Filecoin
  Immutable
  Stellar
  Render
  XT.com
  OKB
OKB  dogwifhat
  Optimism
  Arbitrum
  Bittensor
  Maker
Maker  Wrapped eETH
  The Graph