
Litecoin Price Prediction – November 21
According to the daily chart, the Litecoin price prediction may be looking for support at $210 where the market is likely to rebound.
LTC/USD Market
Key Levels:
Resistance levels: $255, $265, $275
Support levels: $185, $175, $165
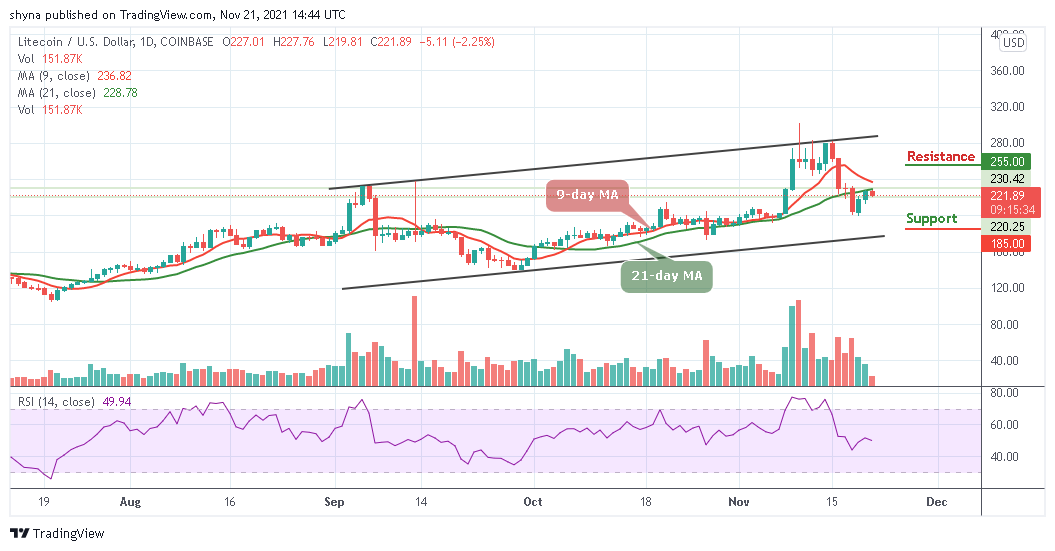
LTC/USD is recording some losses at the time of writing as the price is now hovering around $221.89 below the 9-day and 21-day moving averages. After the opening of today’s trading at $227, the Litecoin price moves to touch the daily low of $219.81 support. Looking at the daily chart, it seems the Litecoin price may be heading back towards the immediate support level of $215 below the moving averages.
Litecoin Price Prediction: Litecoin Price May Retest $200 Support
As the coin moves within the channel, in as much as the Litecoin price drops from the current trading level, the traders may see the cryptocurrency falling to another trading low and a cross below the lower boundary of the channel may provoke a dip decline towards the support levels of $185, $175, and $165.
However, a break above the 9-day and 21-day moving averages may cause the Litecoin price to move towards the nearest resistance level of $200. Therefore, a further bullish push could take LTC/USD to the resistance levels of $255, $265, and $275. On the contrary, the Relative Strength Index (14) is currently facing the south as the signal line remains below 55-level which may cause the market to experience more downtrends.

When compares with Bitcoin, the Litecoin price is still following a bearish movement as the coin stays below the 9-day and 21-day moving averages. Meanwhile, as the daily chart reveals, the Litecoin price is likely to cross below the 21-day moving average to confirm the bearish movement.
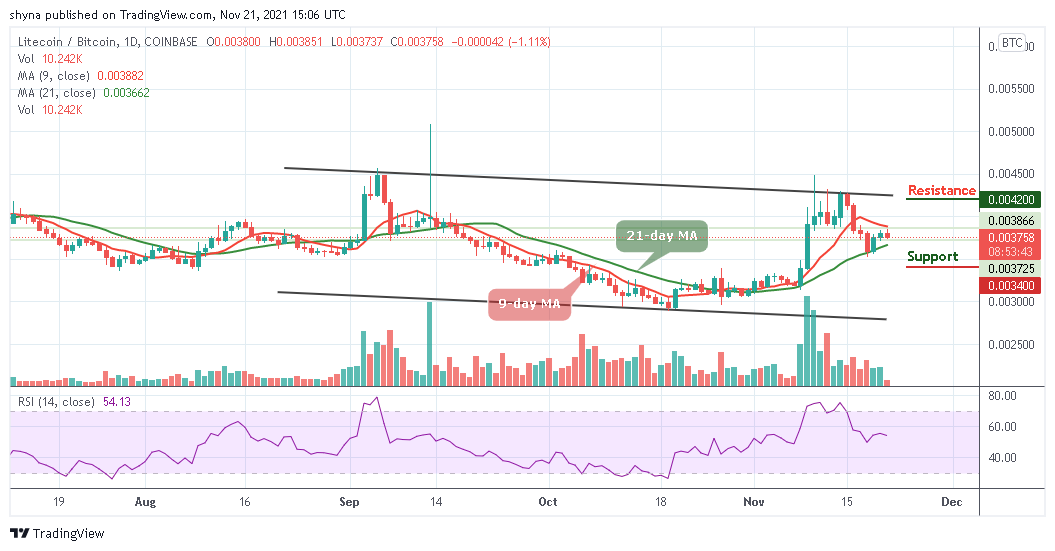
However, as the Relative Strength Index (14) reveals, the signal line is seen pointing to the downside but a bullish move may likely push the market back to the resistance level of 4000 SAT with a possible break above the 9-day and 21-day moving averages. More so, any further bullish movement above this barrier could hit the resistance level of 4200 SAT and above. On the contrary, if the Litecoin price crosses below the 21-day moving average, it could reach the support level of 3400 SAT and below.
Looking to buy or trade Litecoin (LTC) now? Invest at eToro!
68% of retail investor accounts lose money when trading CFDs with this provider
68% of retail investor accounts lose money when trading CFDs with this provider
Credit: Source link


 Bitcoin
  Ethereum
  Tether
  BNB
BNB  Solana
  USDC
USDC  XRP
XRP  Dogecoin
  Toncoin
  Cardano
  Shiba Inu
  Avalanche
  Wrapped Bitcoin
  Bitcoin Cash
  Polkadot
  NEAR Protocol
  Polygon
  Litecoin
  Uniswap
  LEO Token
  First Digital USD
  Hedera
  Aptos
Aptos  Stellar
  Cosmos Hub
  Filecoin
  OKB
OKB  Render
  Immutable
  XT.com
  Pepe
Pepe  Arbitrum
  Bittensor
  Maker
Maker  dogwifhat
  Optimism
  Wrapped eETH
  The Graph
