
The LUNA 2.0 (LUNC) price prediction shows that LUNC may cross above the 9-day moving averages as the RSI (14) moves to cross above the 40-level.
LUNC/USD Long-term Trend: Bearish (45 Minute Chart)
Key Levels:
Resistance levels: $0.000110, $0.000115, $0.000120
Support levels: $0.000080, $0.000075, $0.000070
LUNC/USD is seen heading towards the 9-day and 21-day moving averages within the channel as the price is now trying to create an uptrend. However, should the buyers push LUNC/USD above the 9-day MA, the coin might begin the upward movement and any further bullish movement may cross above the 21-day MA.
LUNA 2.0 Price Prediction: LUNC Price Will Target $0.000105 Level
According to the 45-minute chart, the LUNA 2.0 (LUNC) price needs to stay above the 9-day and 21-day moving averages; if the resistance level of $0.000100 gives way, the bull run may come to focus. At the time of writing, the bullish movement seems to be coming up as buyers are posting strong commitments into the market. Therefore, if the coin stays above the 9-day MA, this could further strengthen the market to hit the potential resistance levels of $0.000110, $0.000115, and $0.000120.

On the downside, a lower possible swing may likely retest the previous support below the moving averages. However, if the bears manage to fuel the market, traders may expect a further drop to $0.000080, $0.000075, and $0.000070 support levels. On the other hand, the technical indicator Relative Strength Index (14) may likely cross above the 40-level, indicating that the market may maintain the bullish movement if it comes to play.
LUNC/USD Long-term Trend: Bearish (15 Minute Chart)
On the 15-minute chart, LUNC/USD is moving to cross above the 9-day and 21-day moving averages. However, if the bullish movement continues, the resistance level of $0.000100 is expected to be visited; more so, there might be a reason to expect the long-term bullish reversal as the red-line of the 9-day MA is also likely to cross above the green-line of the 21-day MA. However, any further bullish movement may hit the potential resistance at $0.000110 and above
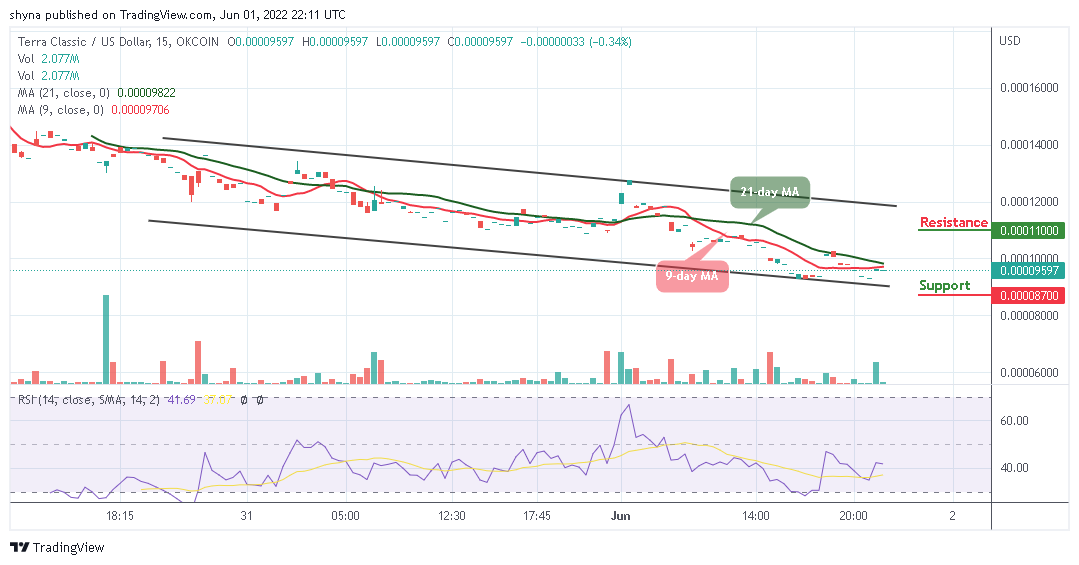
In other words, if the LUNA 2.0 (LUNC) price crosses below the lower boundary of the channel, it could refresh lows under $0.000090, and a possible bearish continuation may likely meet the major support at $0.000088 before falling to $0.000087 and below. Meanwhile, to support the bullish movement, the technical indicator Relative Strength Index (14) is likely to face the 50-level to give more bullish signals.
eToro – Our Recommended Crypto Wallet
- Exchange Wallet for 120+ Cryptocurrencies, Trade In-Wallet
- Automatic Staking of ETH, ADA or TRX in your Wallet
- Regulated by FCA, ASIC and CySEC – Millions of Users
- Unlosable Private Key – Secure eToro Recovery Service
68% of retail investor accounts lose money when trading CFDs with this provider.
Read more:
Credit: Source link


 Joins Dogecoin, XRP, and Cardano in the $1 Race. Who Will Reach This Milestone First?")


 Bitcoin
  Ethereum
  Tether
  BNB
BNB  Solana
  USDC
USDC  XRP
XRP  Dogecoin
  Toncoin
  Cardano
  Shiba Inu
  Avalanche
  Polkadot
  Wrapped Bitcoin
  Bitcoin Cash
  Polygon
  NEAR Protocol
  Litecoin
  LEO Token
  Uniswap
  First Digital USD
  Aptos
Aptos  Hedera
  Cosmos Hub
  Pepe
Pepe  Stellar
  Filecoin
  Immutable
  Render
  XT.com
  OKB
OKB  Optimism
  dogwifhat
  Arbitrum
  Bittensor
  Sui
Sui  Wrapped eETH
  Maker
Maker 
