

- MATIC price long-term price prediction is bullish as it trades within the confines of an ascending parallel channel.
- Polygon sits on strong support provided by the 50-, 100- and 200-day SMA downwards while the IOMAP shows the path with little resistance is upwards.
- However, the MACD has sent a bearish signal and the RSI displays a negative divergence with the recent high meaning that MATIC could continue falling in the near term.
MATIC price is up 5.87% over the last 24 hours and is currently trading in the green around $1.943. Polygon (MATIC) overall market cap has increased 5.87% to $13,808,651,332. However, the daily trading volume has decreased $2,443,048,685 over the same period. The decreasing trading volume is not a good sign for Polygon bulls as it points to a continued price correction.
MATIC price Sits On Strong Support
MATIC/USD price is trading at $1.943 at the time of writing and appears to have formed an ascending parallel channel on the daily chart. An ascending parallel chart pattern is as extremely bullish chart pattern that is formed when an asset record a series of higher highs and higher lows suggesting an uptrend.
Therefore, as long as the price of MATIC remains within the confines of the rising channel, it is set to continue rising.
As such, a daily closure above the immediate resistance provided by the $2.0 psychological level could see the Polygon price to tag the middle boundary of the prevailing chart pattern around $2.141.
A rise beyond the aforementioned level will confirm MATIC’s bullish rally that could see the asset rise above the $2.50 psychological level to tag the target of the governing chart pattern at $2.628 embraced by the upper boundary of the rising channel.
MATIC/USD Daily Chart
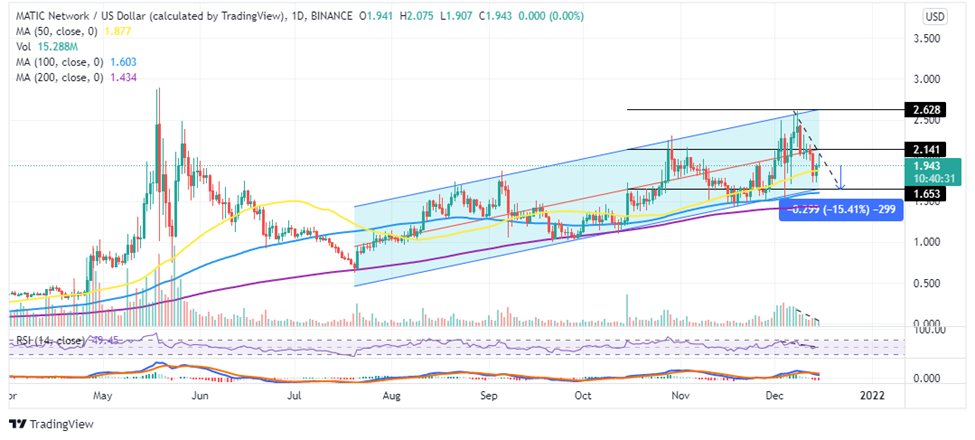
The position of the Moving Convergence Divergence Indicator (MACD) above the zero line and the fact that MATIC still remains within the confines of the rising channel validates Polygon’s bullish outlook.
In addition, MATIC price sits on strong support provided by the 50-day Simple Movign Average (SMA) at $1.877, the 100-day SMA at $1.603 and the 200-day SMA at $1.434.
Moreover, on-chain metrics from In/Out of the Money Around Price (IOMAP) Model by IntoTheBlock shows that MATIC sits on relatively robust support downwards. For example, the support provided by the 50 SMA at $1.877 is within the $1.83 and $1.89 price range where approximately 187.8 million MATIC were previously bought by roughly 12,400 addresses.
This support is robust enough is absorb any selling pressure that is threatening to pull MATIC below this point.
Polygon IOMAP Chart
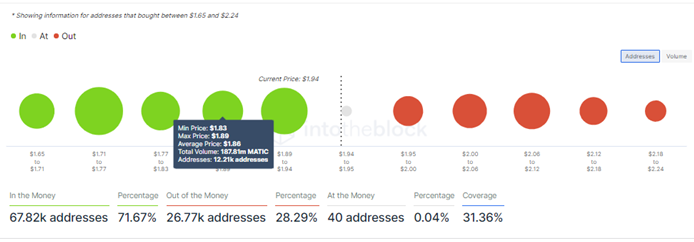
Polygon IOMAP Chart by IntoTheBlock
On the other hand, the immediate resistance around $1.96 is within the $1.95 and $2.00 price range where approximately 150 million MATIC were previously bought by roughly 4,920 addresses. Such resistance does not appear significant enough to curtail any efforts to such MATIC past this point.
Therefore, the IOAMP model indicates that the path with the least resistance for Polygon price is upwards.

BUT, Polygon Looks Bearish At The Moment
Despite the bullish outlook for Polygon described above, that could be for the longer term.
A look at the recent price action on the daily chart points to a continued price correction in the near term. For example, the MATIC has been recording lower highs and lower lows since December 07 as shown by the down trendline.
In addition, the decreasing daily trading volume and the downward movement of the Relative Strength Index (RSI) indicator shows that the bears are determined to push the MATIC price lower.
Moreover, the downward movement of the Moving Average Convergence Divergence (MACD) indicator suggests that Polygon’s market sentiment is bearish. Furthermore, the MACD recent sent a call to sell MATIC signal on the same daily chart. This happened yesterday day when the MACD line (12-day Exponential Moving Average-EMA) crossed below the 12-day EMA (orange line) pointing to a bearish MATIC.
Therefore, failure for MATIC price to hold above the 50-day SMA at $1.877, it will drop to tag the $1.809 support wall. A drop below this point could trigger massive sell orders that could see Polygon drop to tag the lower boundary of the ascending channel at $1.6353. If this happens, Polygon price will shed approximately 15.47% from its current price.
Where To Buy Polygon Now
If you are looking for to buy cryptocurrencies such as Polygon (MATIC), global crypto exchanges such as eToro are worth a look. Read our guide on the best trading platforms for a review of eToro to find out more about the pioneer on social trading.
With eToro, there are no trading fees, with the platform making its money in the spread between the bid and ask price. The minimum trade size for crypto assets is $25.
Looking to buy or trade Polygon (MATIC) now? Invest at eToro!
Your capital is at risk
Read more:
Credit: Source link

")


")


 Bitcoin
  Ethereum
  Tether
  BNB
BNB  Solana
  USDC
USDC  XRP
XRP  Dogecoin
  Toncoin
  Cardano
  Shiba Inu
  Avalanche
  Wrapped Bitcoin
  Bitcoin Cash
  Polkadot
  NEAR Protocol
  Polygon
  Litecoin
  Uniswap
  LEO Token
  First Digital USD
  Aptos
Aptos  Hedera
  Stellar
  Filecoin
  Cosmos Hub
  XT.com
  OKB
OKB  Render
  Pepe
Pepe  Immutable
  Arbitrum
  Bittensor
  dogwifhat
  Wrapped eETH
  Optimism
  Maker
Maker  The Graph