
2022 Review
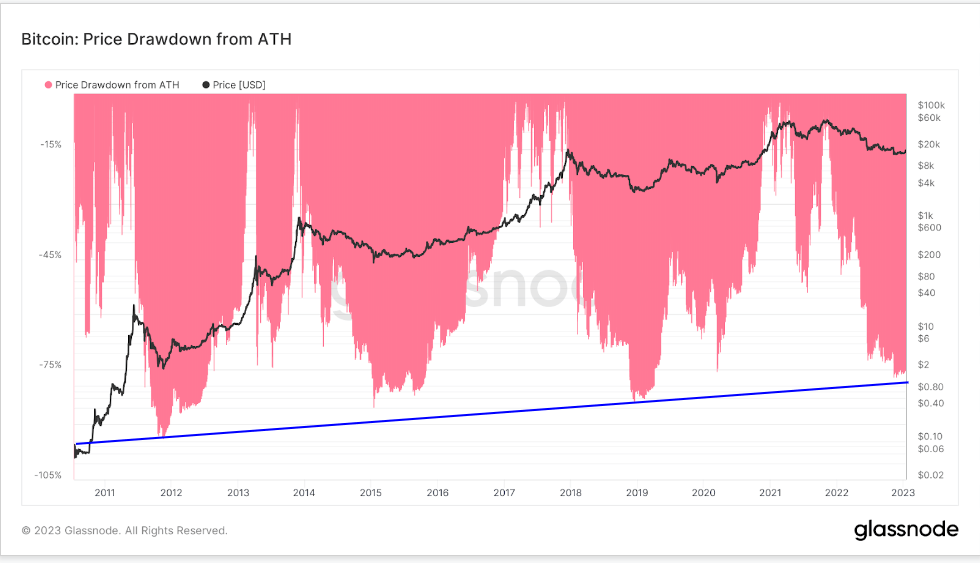
2022 was an unprecedented year of demand destruction and wealth destruction across financial asset classes. Bitcoin was down 75% from its all-time high. However, this is its fourth worst drawdown and continues to make lower highs each cycle.
For many a decade, the 60/40 portfolio of stocks and bonds protected investors in the worst of times as treasuries were able to hedge against the downside volatility in equities. However, treasuries performed even worst than equities, a feat that hadn’t occurred long before the ’60s.
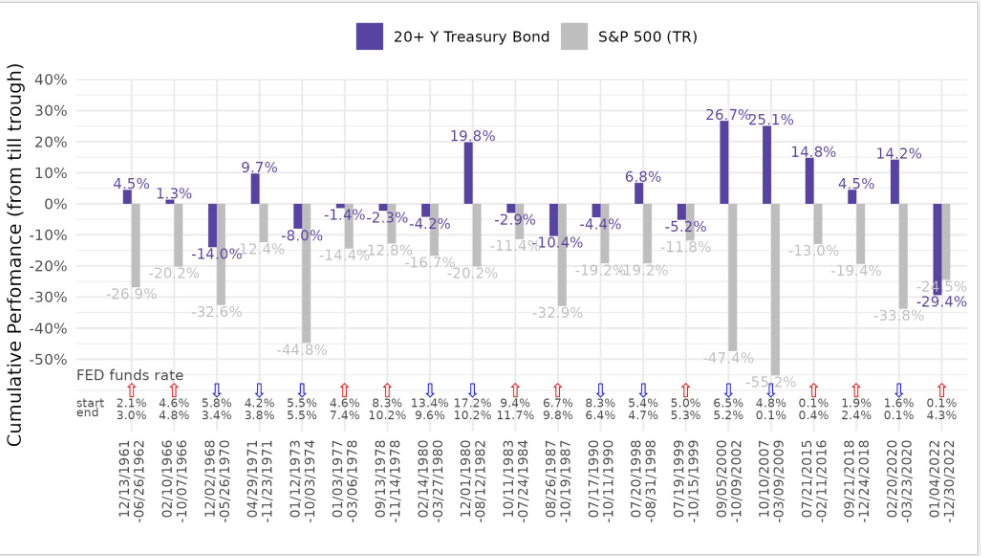
In addition, U.S. stocks vs. bond returns were as bad as in 1931 and 1969. Subsequently, two years after both 1931 and 1969, was executive order 6102, the confiscation of gold (this is also where the difficulty adjustment in terms of 2016 blocks came from), and 1971 when the U.S. went off the gold standard. So by that nature, all eyes are on 2024.
For more info on this, please see our recent BitTalk episode

2% inflation target
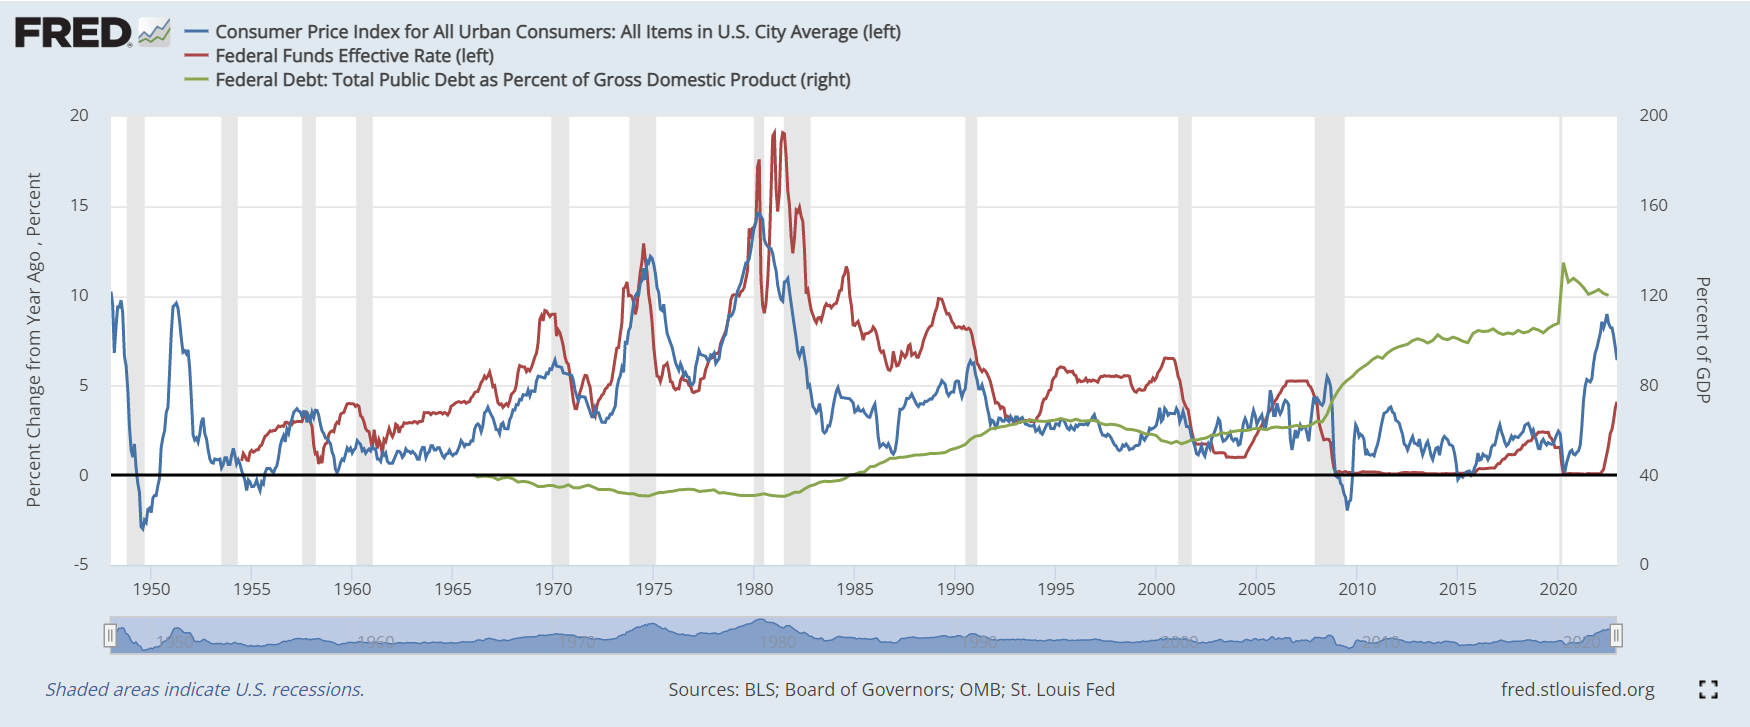
Since 1977, the Federal Reserve has operated under a mandate from Congress to “promote effectively the goals of maximum employment, stable prices, and moderate long-term interest rates” now known as the dual mandate.
We can confidently say this has not been met, as interest rates have been at the lower bound of 0 for over a decade. CPI inflation was at 6.5% this week, coming down from 7.1%, with maximum employment as the lagging indicator. However, notable layoffs have started, especially in the tech and banking sectors.
As a result, central banks worldwide have been tightening for the past year, some more aggressive than others, with an ever-growing probability of stagflation, a repeat of the 1970s. Stagflation is a combination of high inflation and economic stagnation, particularly high unemployment, which is yet to occur.
Due to the exponential debt problem in western economies, with debt to GDP of 120% in the U.S, taking interest rates above CPI inflation would destroy the economy, governments will opt to take the route of austerity, however this is not the method citizens advocate for.
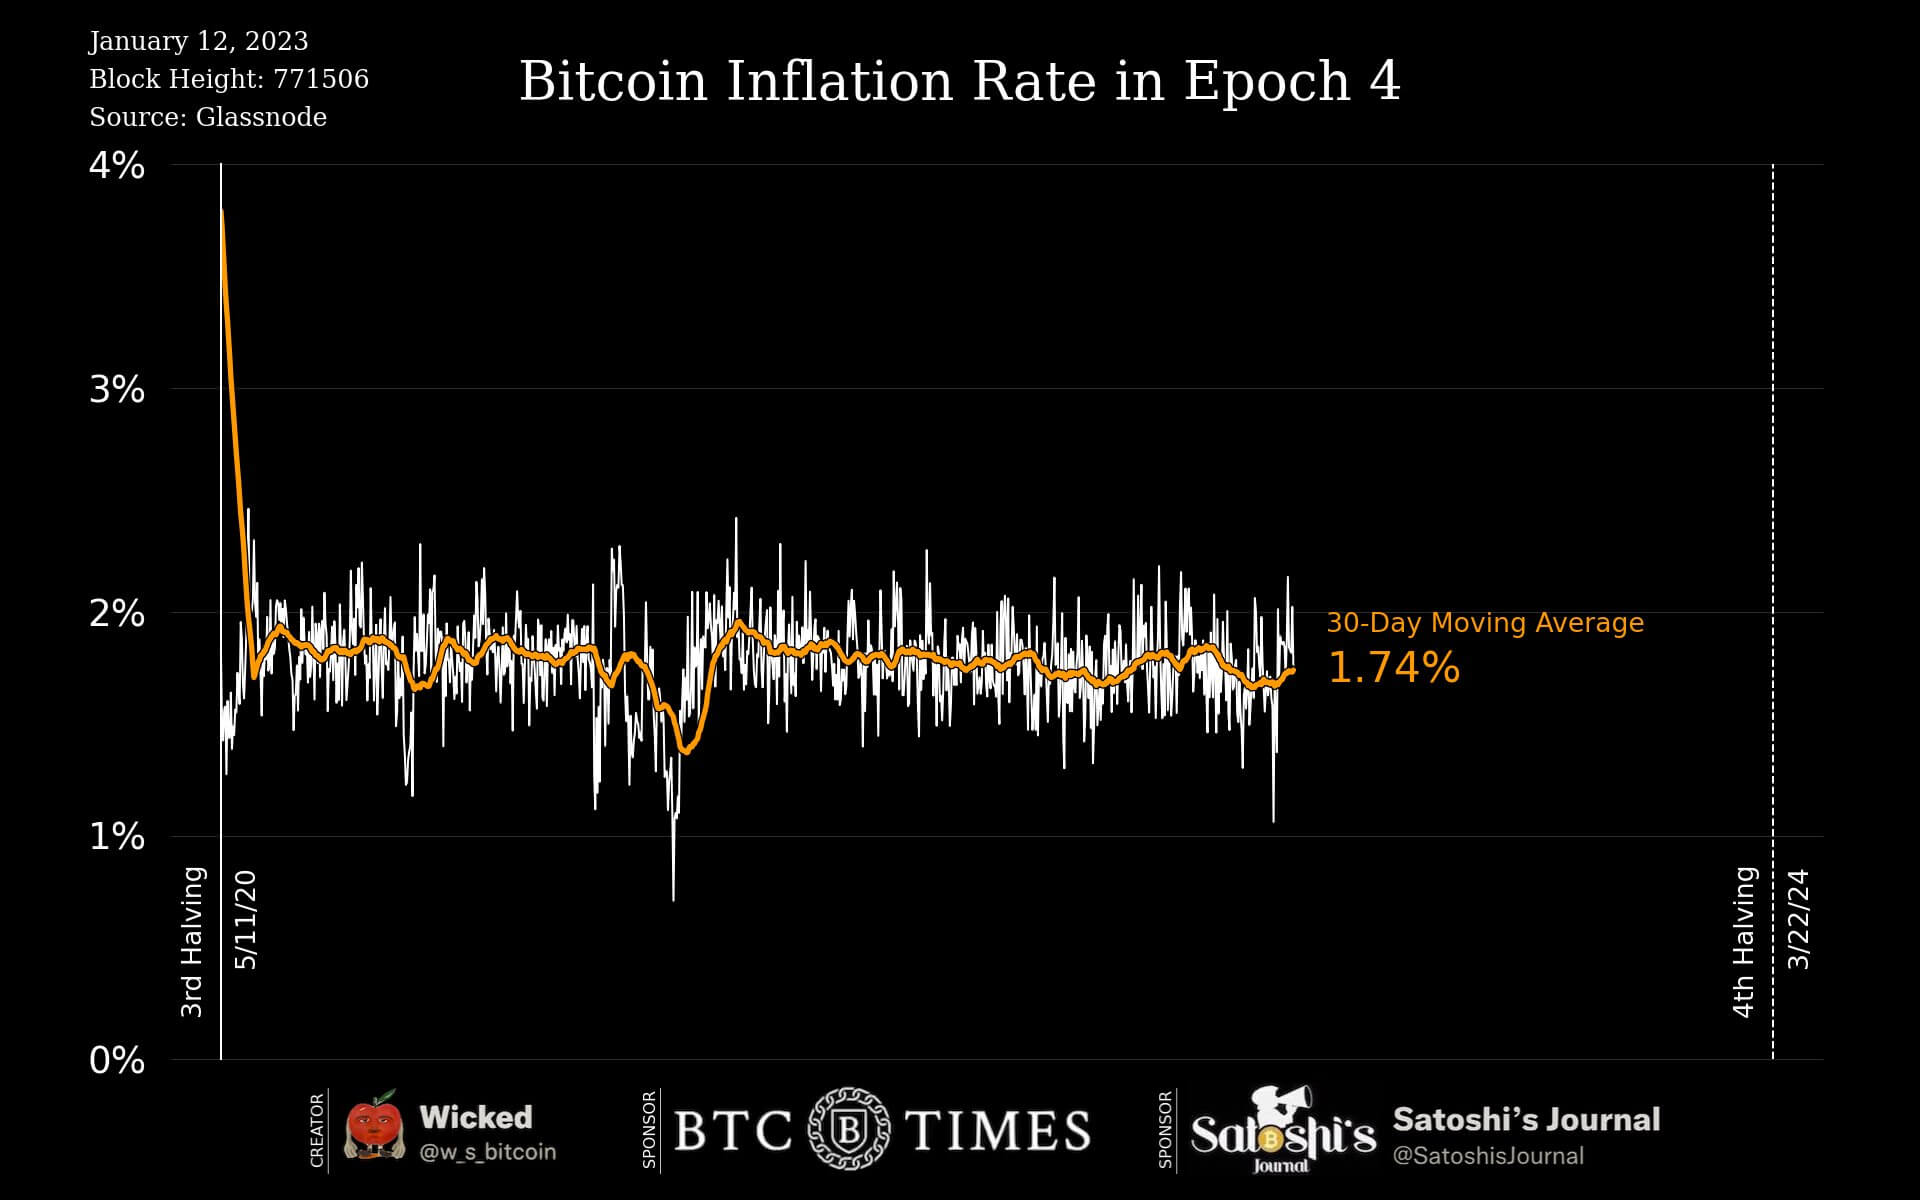
The amusing side to this is Bitcoin current inflation rate is less than 2%, 1.78% to be exact, during this epoch, lower than the central bank’s target. Bitcoin inflation rate is the percentage of new coins issued divided by the current supply. Bitcoin has a predictable monetary schedule, which sees 6.25 Bitcoin getting mined approximately every 10 minutes.
It wasn’t all doom and gloom for Bitcoin in 2022
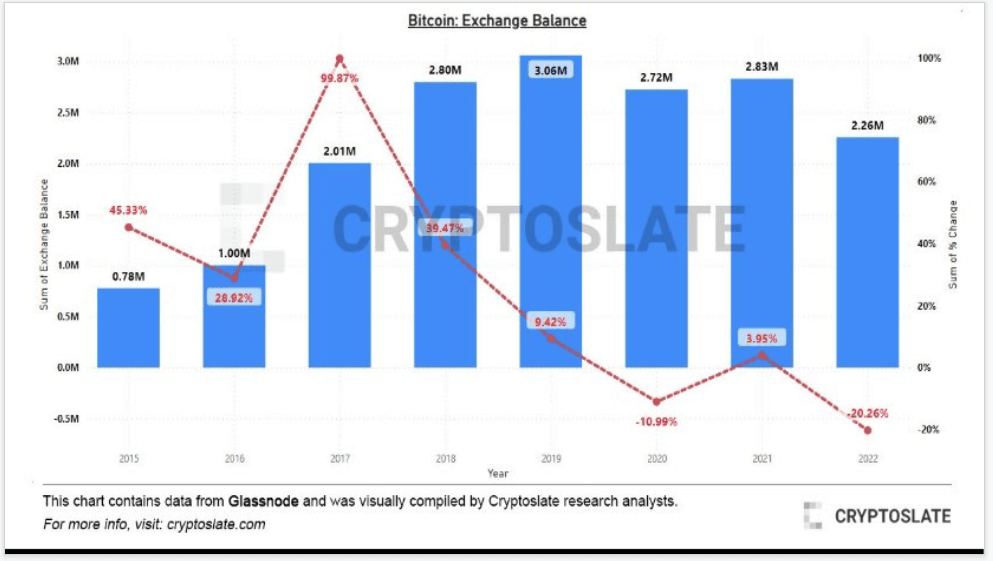
2022 saw the most amount of Bitcoin withdrawn from exchanges, over 20%, which previously beat 2020 that saw over 10% leave exchanges.
Currently 2.26m Bitcoin sit on exchanges which leaves around 11-12% of the Bitcoin supply on exchanges. Many events triggered the exodus such as Luna and FTX collapse.
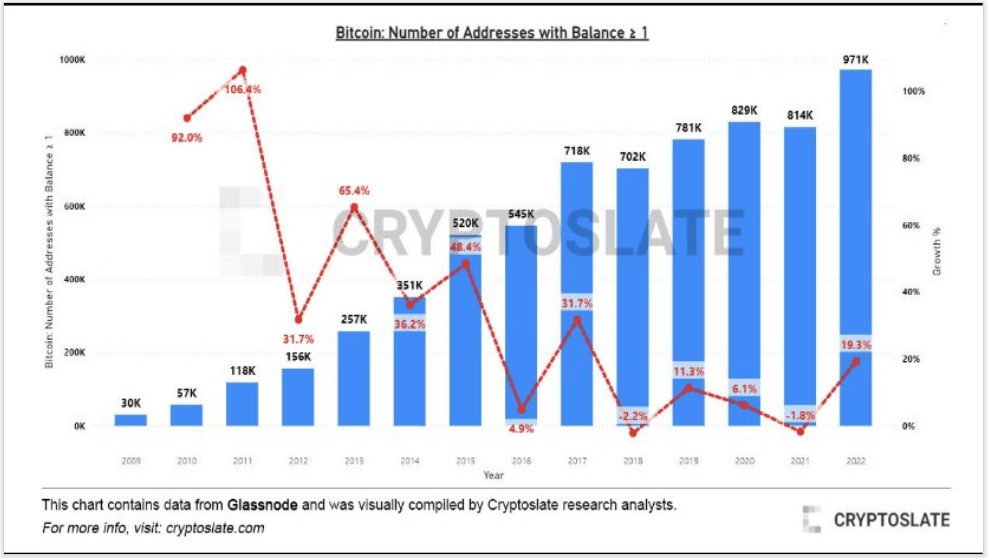
As Bitcoin continues to leave exchanges in 2022, the number of addresses holding Bitcoin increased. We’re approaching 1,000,000 unique addresses holding at least 1 Bitcoin.
A 19% increase in 2022, saw the biggest year-over-year growth % since 2017.
Bitcoin broke through the short-term holder cost basis
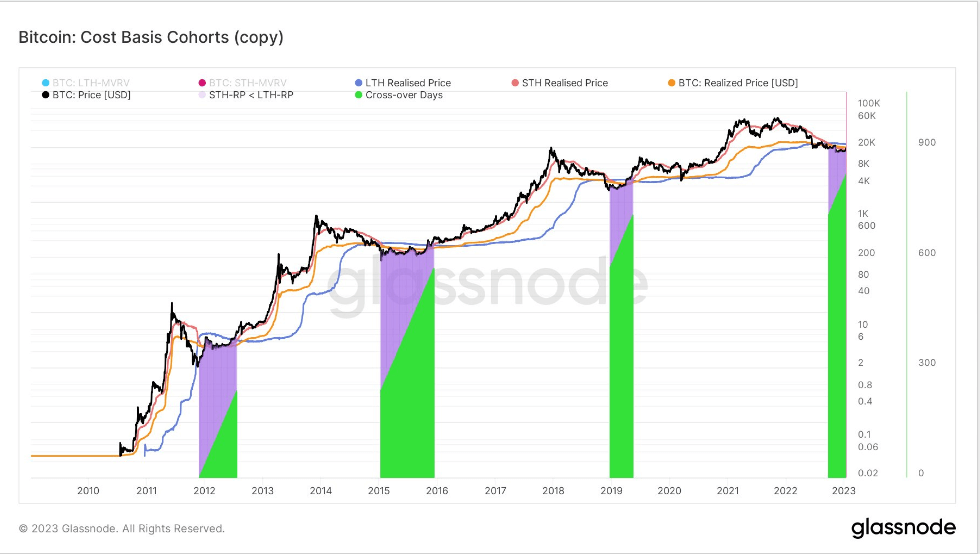
Realized Price reflects the aggregate price when each coin was last spent on-chain.
Using Short- and Long-Term Holder cohorts, we can calculate the realized price to reflect the aggregate cost basis for each group.
The LTH-STH Cost Basis Ratio is then calculated as the ratio between LTH and STH realized price.
As STHs are realizing losses at a greater rate than LTHs this is a typical example of bear market accumulation.
Bitcoin has had 4 periods in history where STH, LTH, and realized price has crossed over, amounting to 829 days. Currently at day 110, and the shortest of all 4 periods, we would need to break $22.5k, to get out of the cross over.
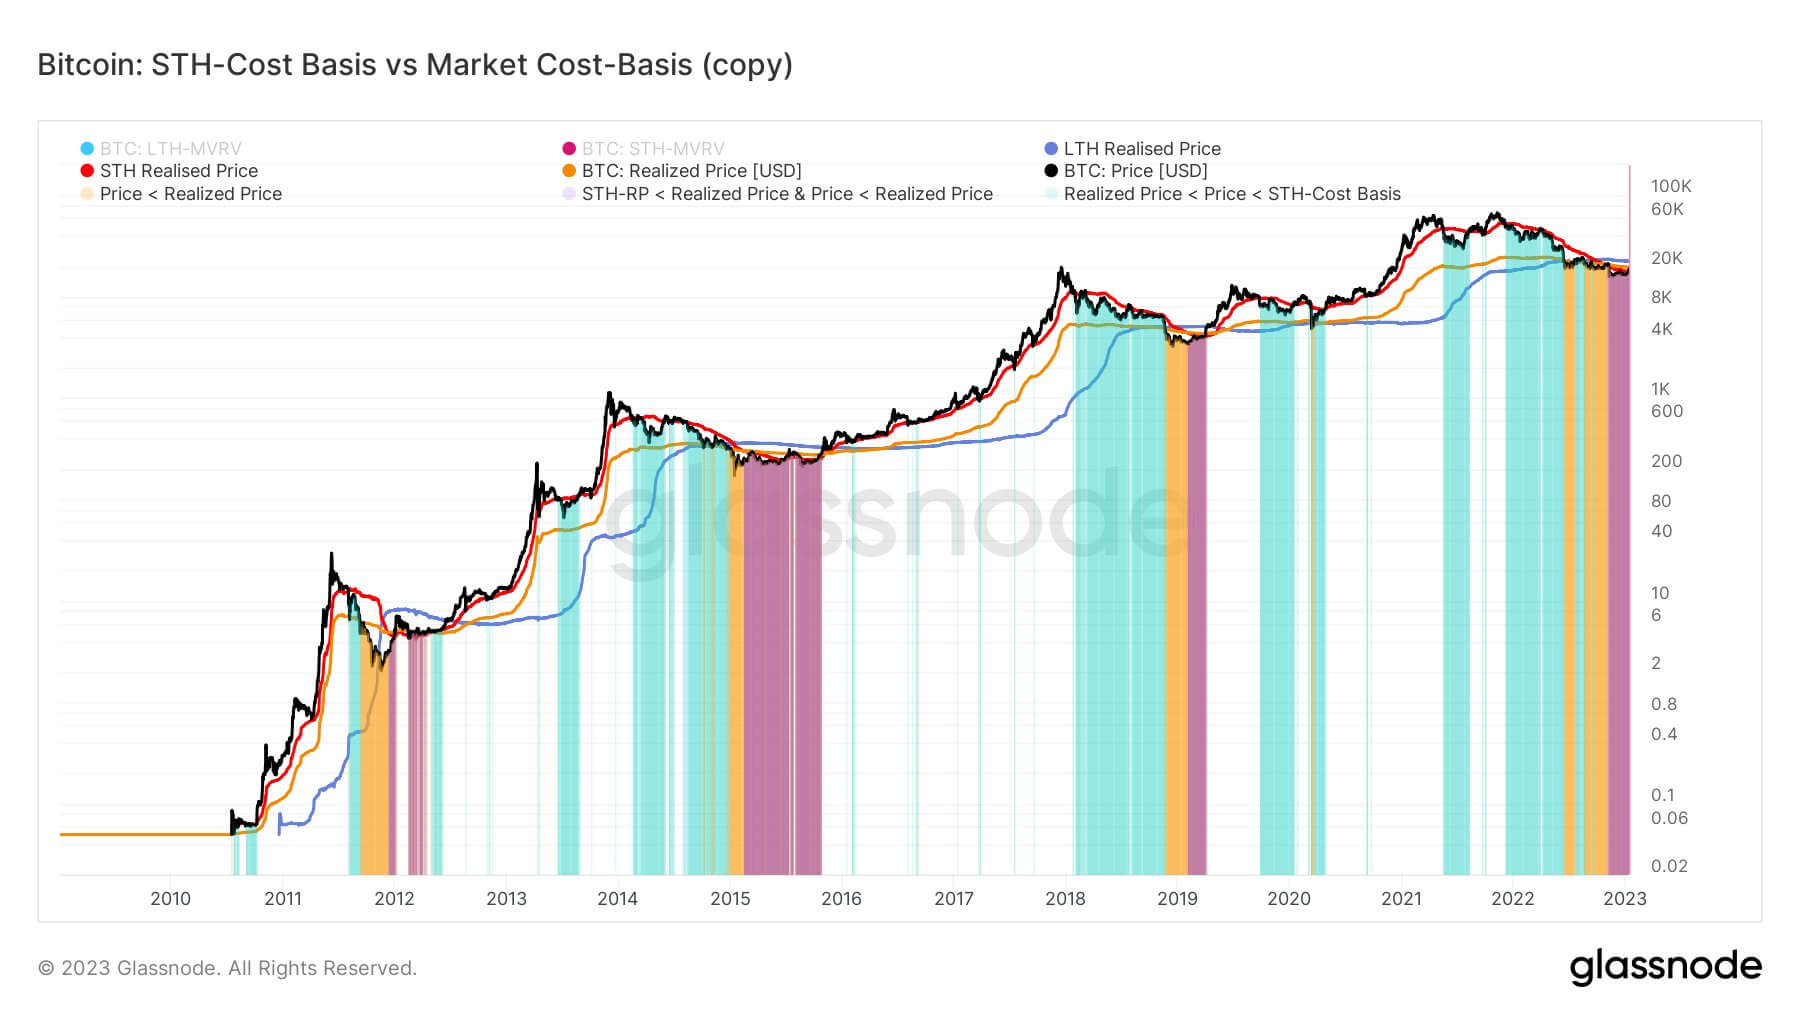
During the depths of bear markets, Bitcoin has only entered the region of being below realized price, STH and LTH realized price on a handful of occasions and they all occur during late stage bear markets which seems to be the same this cycle.
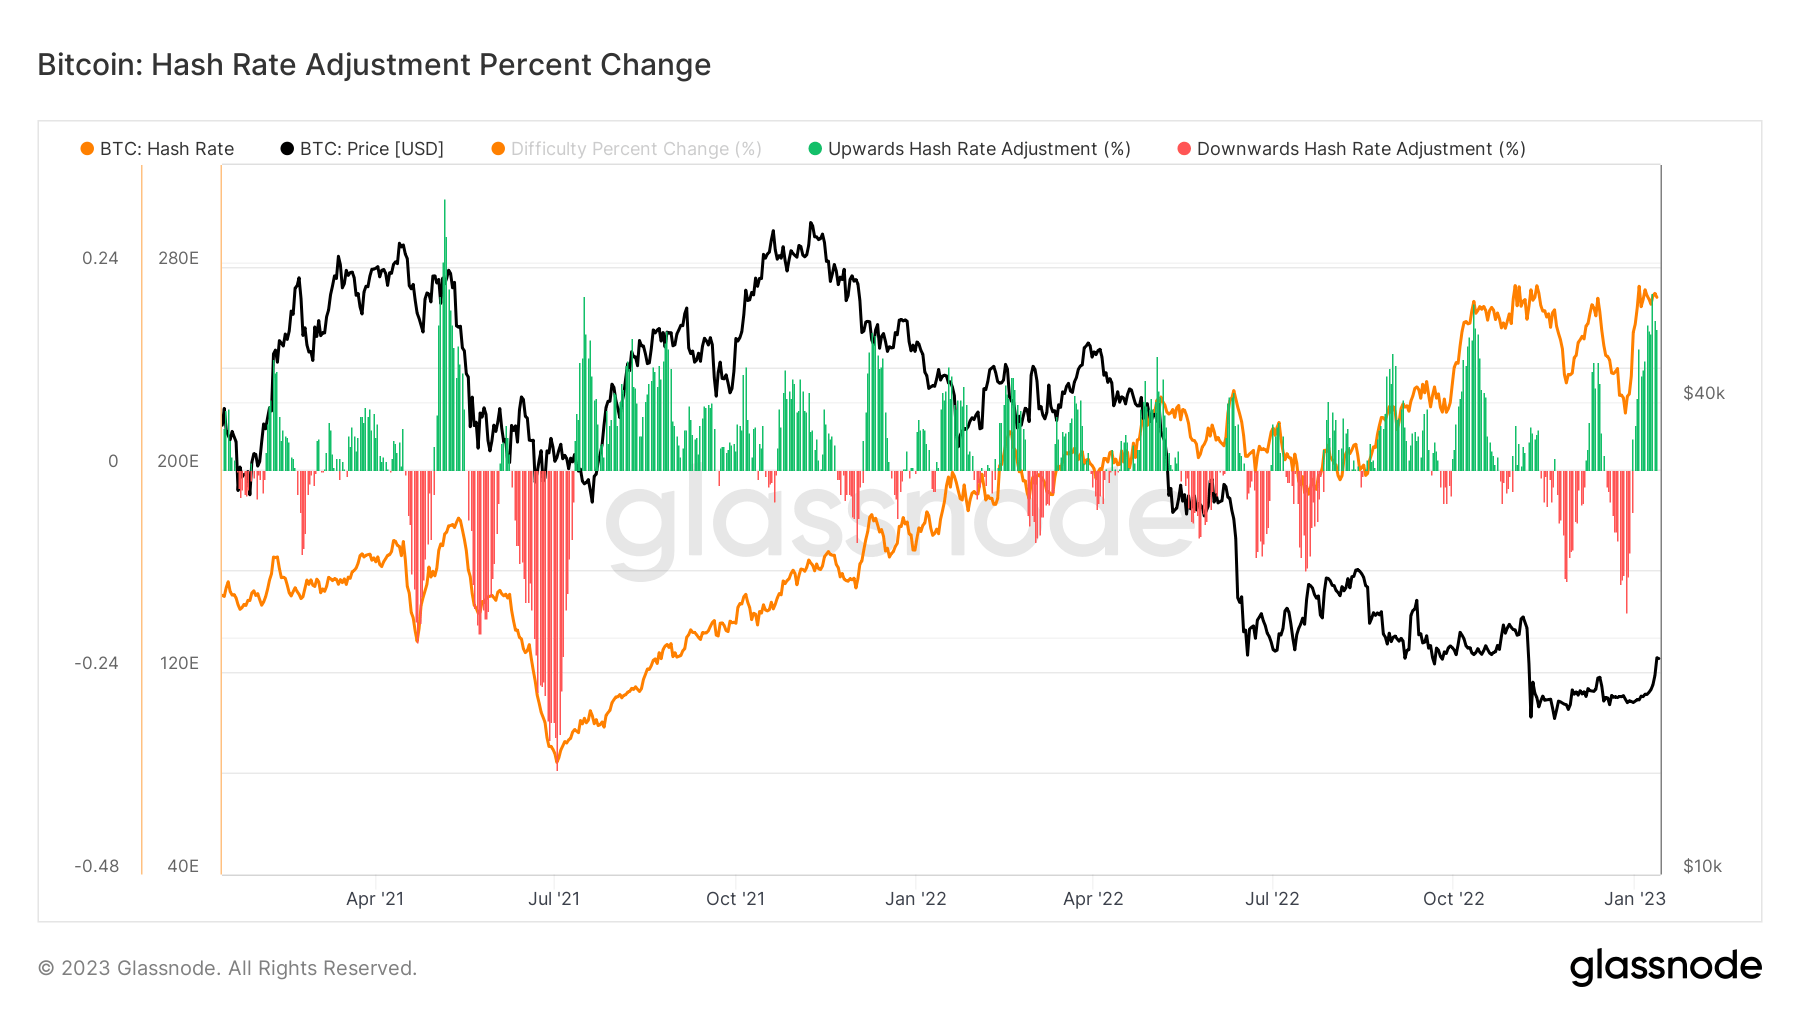
Relentless Miners
Hash rate went to a new all time high at the beginning of Jan, over 300 TH/s, which is quite a spectacular feat in a bear market.
Due to the cheap debt acquired in 2021, miners are plugging in and companies that have filed for chapter 11 bankruptcy have not unplugged machines which could be a reason that hash rate declined less during other bear markets.
Subsequently hash rate, soared 20% in one day, one of the biggest one day % change in recent years.
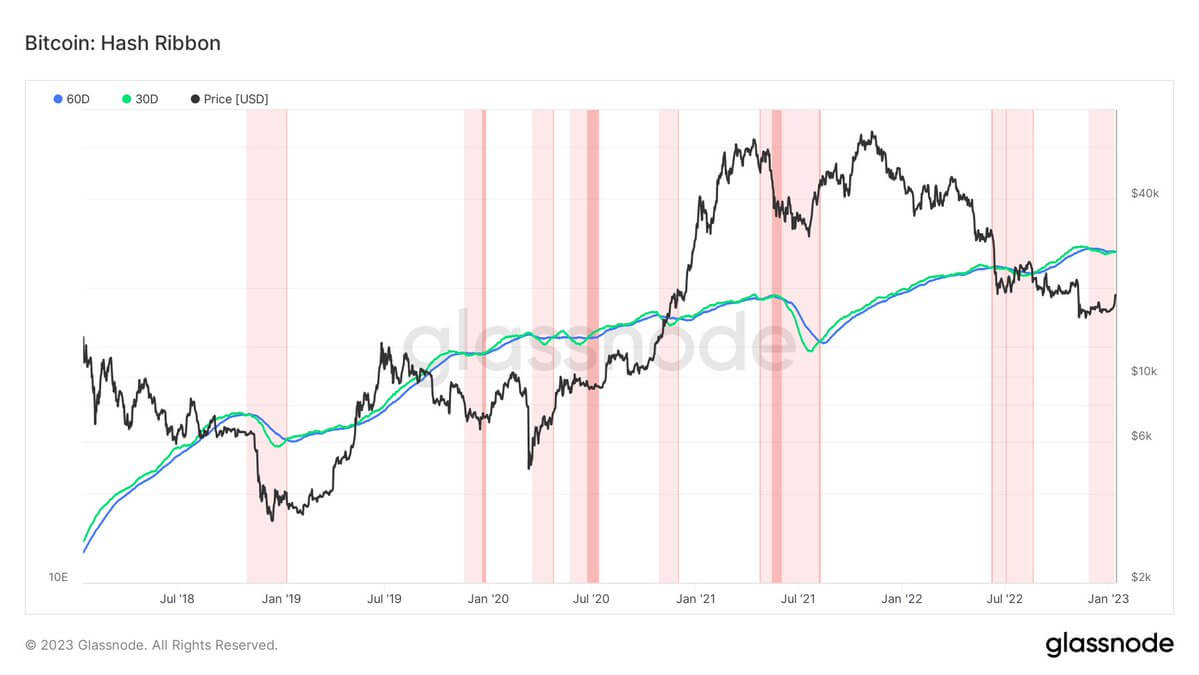
As a result of a soaring hash rate, hash ribbon inversion is about to end, signaling the end of a miner capitulation. Bitcoin tends to reach a bottom when miners capitulate as Bitcoin becomes too expensive to mine, price tends to go up after miners capitulate, which is what we are seeing again.
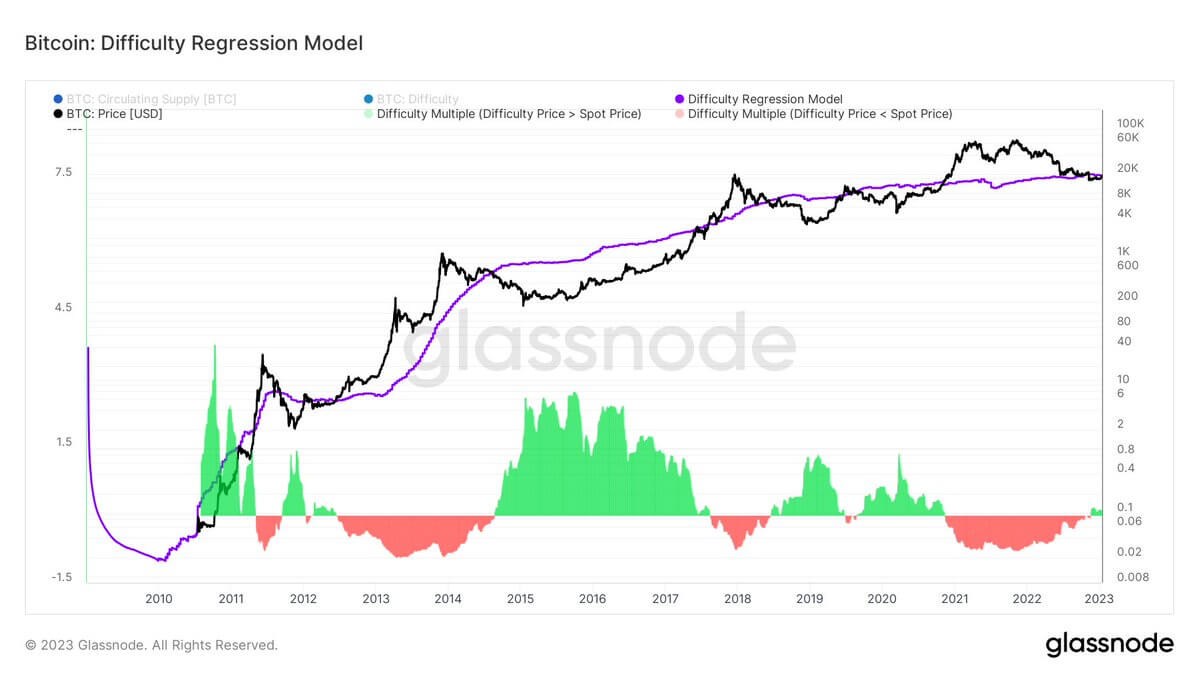
Last, the difficulty regression model shows that we are on the periphery of Bitcoin mining, about to become once again profitable.
The Difficulty Regression Model is an estimated all-in-sustaining cost of production for Bitcoin. The current estimated cost is based off difficulty and market cap. BTC will need to get above $19k for miners to become profitable on average.
As you can see, during bear markets, Bitcoin becomes unprofitable as the price drops below the all-in cost of production, which is why the hash rate drops as miners have to unplug. As we stated above, this bear market is different from all others.
Credit: Source link


 Bitcoin
  Ethereum
  Tether
  BNB
BNB  Solana
  USDC
USDC  XRP
XRP  Dogecoin
  Toncoin
  Cardano
  Shiba Inu
  Avalanche
  Wrapped Bitcoin
  Bitcoin Cash
  Polkadot
  NEAR Protocol
  Polygon
  Litecoin
  Uniswap
  LEO Token
  First Digital USD
  Aptos
Aptos  Hedera
  Stellar
  Filecoin
  Cosmos Hub
  OKB
OKB  Render
  XT.com
  Immutable
  Pepe
Pepe  Arbitrum
  Bittensor
  Maker
Maker  Optimism
  Wrapped eETH
  dogwifhat
