
Join Our Telegram channel to stay up to date on breaking news coverage
SHIB is bearish
SHIBUSD Price Analysis – October 13
In case the sellers’ momentum increase further and break down $0.0000088 level, SHIB may decrease further to $0.0000076 levels and the support level of $0.0000068 may be tested. Should the buyers oppose the sellers at support level of $0.0000088, price may increase and penetrate $0.000009 upside, $0.000010 and $0.000011 may be tested.
Key levels:
Resistance levels: $0.000009, $0.000010, $0.000011
Support levels: $0.0000088, $0.0000076, $0.0000068
SHIBUSD Long-term Trend: Bearish
On the daily chart, SHIBUSD is on the bearish movement. The crypto was on the range movement within the resistance level of $0.000011 and the support level of $0.000010. On October 10, sellers gained more pressure and the mentioned support level was penetrated downside. SHIB reduces to the support level of $0.000009 at the moment further price reduction envisaged.
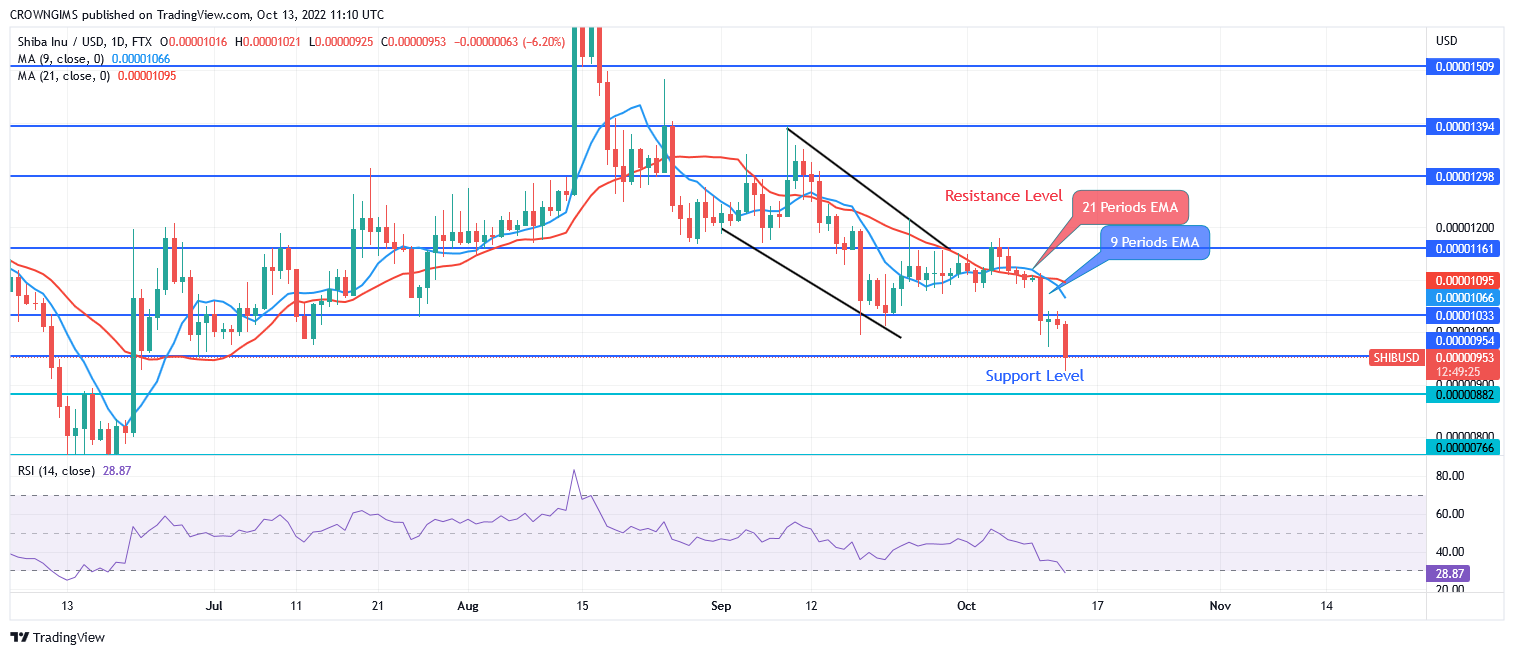
The price is trading below the two EMAs as a sign of bearish movement. The fast Moving Average (9 periods EMA) is crossing the slow Moving Average (21 periods EMA) downside. In case the sellers’ momentum increase further and break down $0.0000088 level, price may decrease further to $0.0000076 levels and the support level of $0.0000068 may be tested. Should the buyers oppose the sellers at support level of $0.0000088, price may increase and penetrate $0.000009 upside, $0.000010 and $0.000011 may be tested. However, the relative strength index period 14 is at 29 levels displaying bearish direction.

Buy SHIB Now
Your capital is at risk
SHIBUSD medium-term Trend: Bearish
SHIBUSD is bearish in the 4-hour chart. Sellers refuse to be defeated by the bulls when it was opposed by the sellers at $0.000010 and the price tested $0.000011 level. Sellers gain more momentum and the support level of $0.000010 is broken downside. SHIB is struggling to break down $0.0000096 level.
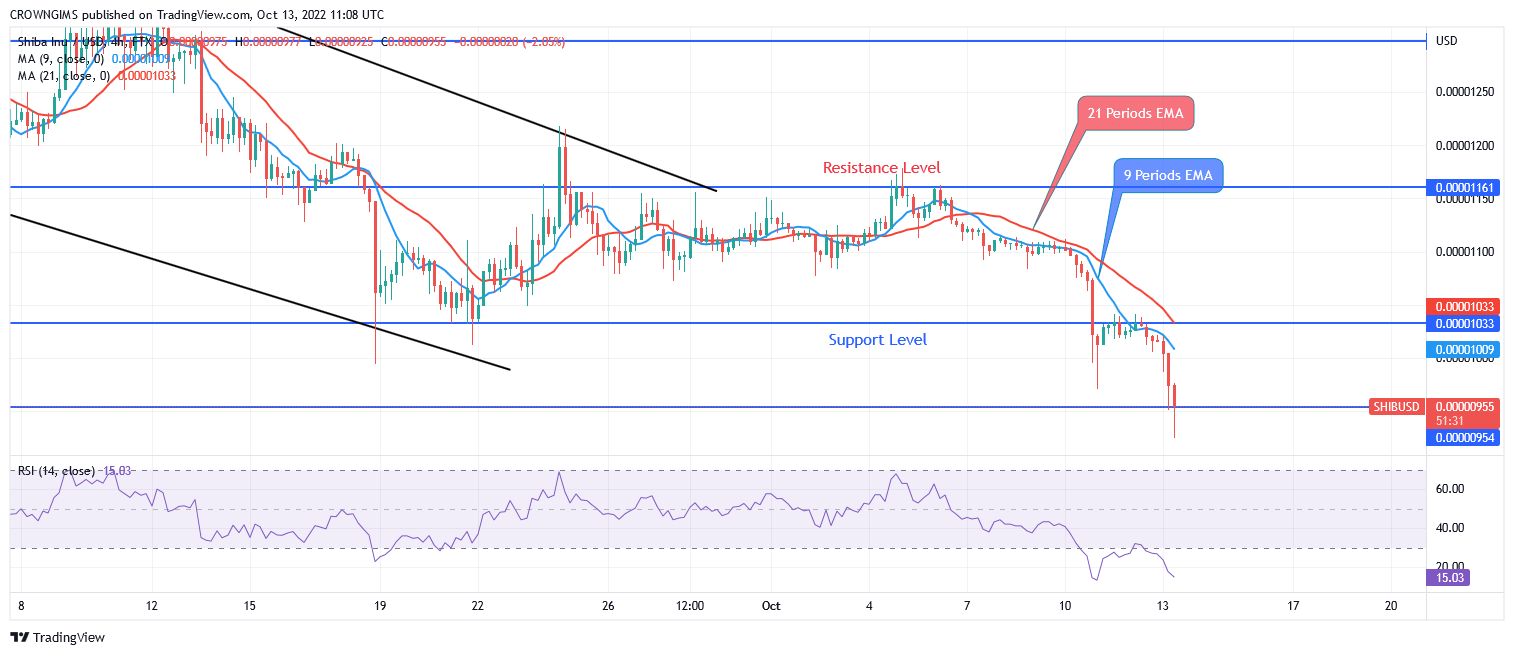
The coin is trading below the 21 periods EMA and 9 periods EMA. The fast moving EMA is below the slow moving EMA which indicates a strong bearish momentum in Shiba Inu market. The relative strength index period 14 is at 15 levels and the signal lines is exhibiting sell signal.
Tamadoge – Play to Earn Meme Coin

- Earn TAMA in Battles With Doge Pets
- Maximum Supply of 2 Bn, Token Burn
- Now Listed on OKX, Bitmart, LBank, MEXC, Uniswap
- Ultra Rare NFTs on OpenSea
Join Our Telegram channel to stay up to date on breaking news coverage
Credit: Source link


")


 Bitcoin
  Ethereum
  Tether
  BNB
BNB  Solana
  USDC
USDC  XRP
XRP  Dogecoin
  Toncoin
  Cardano
  Shiba Inu
  Avalanche
  Wrapped Bitcoin
  Bitcoin Cash
  Polkadot
  NEAR Protocol
  Polygon
  Litecoin
  Uniswap
  LEO Token
  First Digital USD
  Aptos
Aptos  Hedera
  Stellar
  Filecoin
  Cosmos Hub
  Pepe
Pepe  OKB
OKB  XT.com
  Immutable
  Render
  Arbitrum
  Wrapped eETH
  dogwifhat
  Bittensor
  Optimism
  Maker
Maker  The Graph
