
Quick Take
An analysis of the CBOE Volatility Index (VIX), a critical market indicator often used to measure the market’s expectation of future volatility, reveals intriguing patterns. The evaluation of average daily change in the VIX from 1990 to 2023 indicates a propensity for the index to dip markedly on Fridays, with Tuesdays trailing. This trend substantiates the existing theory of VIX compression on Fridays, adding empirical validation to this common market belief.
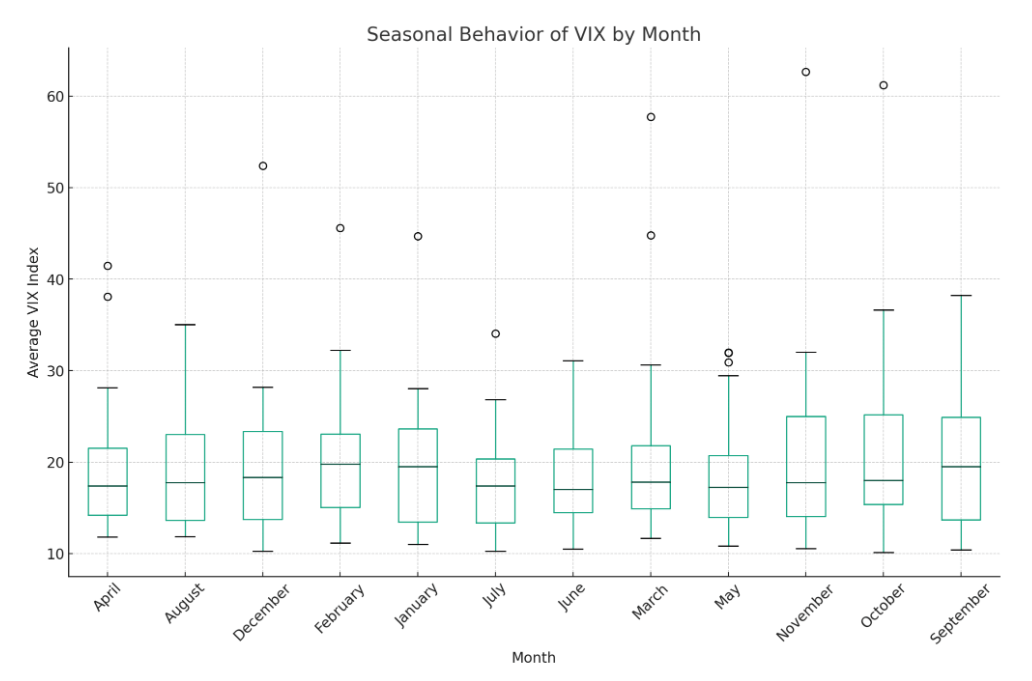
On a broader scale, a boxplot distribution of the average VIX index across each month of these years unveils seasonal tendencies. October and November, characterized by wider VIX distributions, are indicative of heightened variability. This observation reinforces the perception of these months being more prone to volatility. On the flip side, months such as May and June exhibit lower VIX averages, signaling periods of reduced volatility.
Interestingly, certain months like October spotlight outliers, suggesting instances when the VIX notably deviated from its typical range. This signifies years when volatility in the equities market reached exceptional highs or dipped to unusual lows.
These insights into the weekly and seasonal VIX patterns provide a data-driven lens to understand the rhythm of the equities market, a crucial aspect of strategic financial planning and decision-making.
The post Surges in market volatility pinned to autumn months appeared first on CryptoSlate.
Credit: Source link


")


 Bitcoin
  Ethereum
  Tether
  BNB
BNB  Solana
  USDC
USDC  XRP
XRP  Dogecoin
  Toncoin
  Cardano
  Shiba Inu
  Avalanche
  Wrapped Bitcoin
  Polkadot
  Bitcoin Cash
  NEAR Protocol
  Polygon
  Litecoin
  Uniswap
  Fetch.ai
  LEO Token
  Hedera
  Aptos
Aptos  First Digital USD
  Pepe
Pepe  Render
  Cosmos Hub
  dogwifhat
  Filecoin
  Immutable
  Stellar
  Wrapped eETH
  XT.com
  OKB
OKB  Optimism
  Bittensor
  Arbitrum
  Maker
Maker  The Graph
