Join Our Telegram channel to stay up to date on breaking news coverage
The Graph price prediction currently lacks short and medium-term support. However, if the price continues to rise, the coin is anticipated to face upward momentum.
The Graph Prediction Statistics Data:
- The Graph price now – $0.142
- The Graph market cap – $1.3 billion
- The Graph circulating supply – 9.3 billion
- The Graph total supply – 10.7 billion
- The Graph CoinMarketCap ranking – #47
GRT/USD Market
Key Levels:
Resistance levels: $0.180, $0.190, $0.200
Support levels: $0.090, $0.080, $0.070
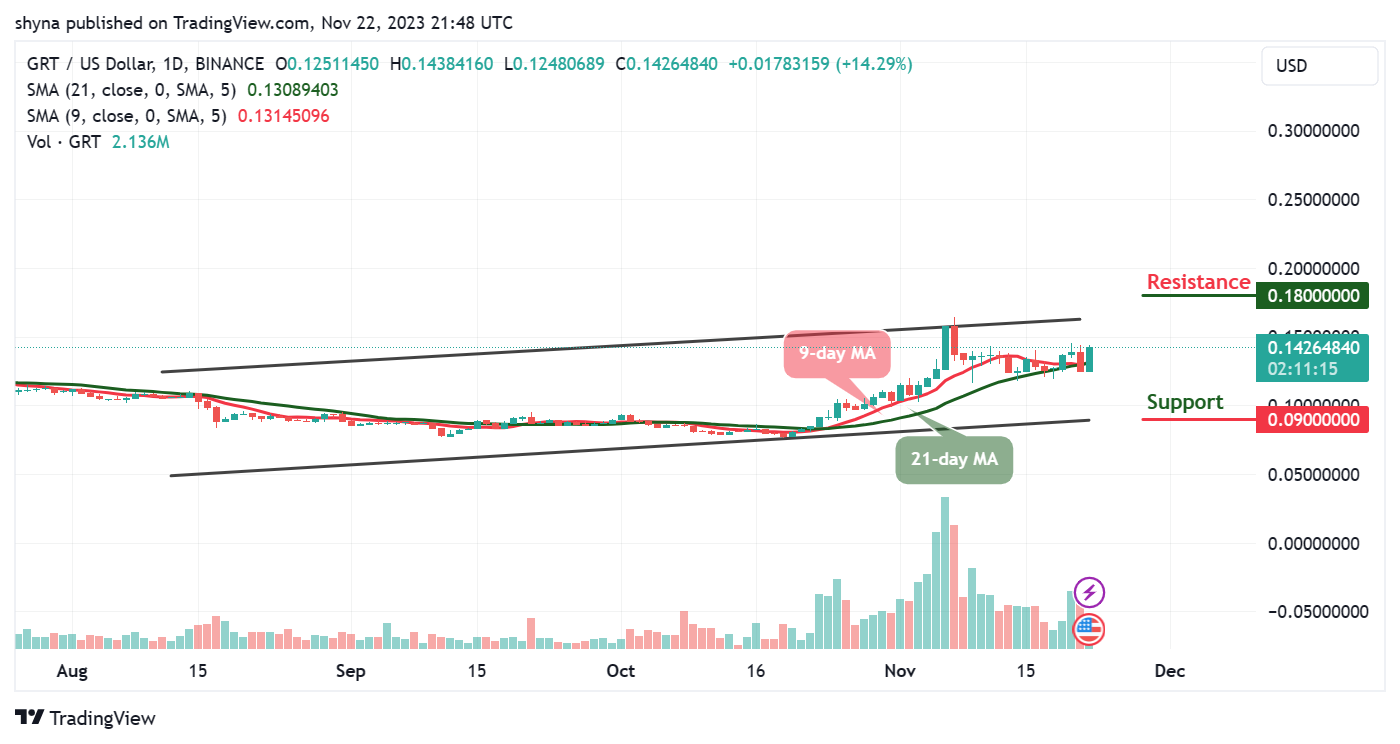
GRT/USD is trading around the $0.142 resistance level, but the coin may need to stay above the 9-day and 21-day moving averages for it to touch the nearest resistance level of $0.150. However, if the bulls push the market price near the upper boundary of the channel, it could locate the resistance level of $0.145. Moreover, if the market increases, additional resistance can be found above the channel.
The Graph Price Prediction: GRT May Break to the Upside
At the time of writing, traders could see that the Graph price may likely create more bullish trends once the sideways movement is over and this is noticeable as the 9-day moving average keeps hovering above the 21-day moving average.
Meanwhile, the market decides to rebound from the low of $0.124 around the 21-day moving average but any bearish movement below this barrier could lead the coin to a serious downtrend. However, the support levels for the coin could be found at $0.090, $0.080, and $0.070, while the resistance levels lie at $0.180, $190, and $200 respectively.
GRT/BTC Price Remains in a Range
Against Bitcoin, the support level for the Graph (GRT) is built around 345 SAT. The resistance is set at 380 SAT because the market price is still changing within the moving averages. Technically, the price continues to move sideways within the channel and the 9-day MA is likely to cross below the 21-day MA which could bring the bears back into the market.
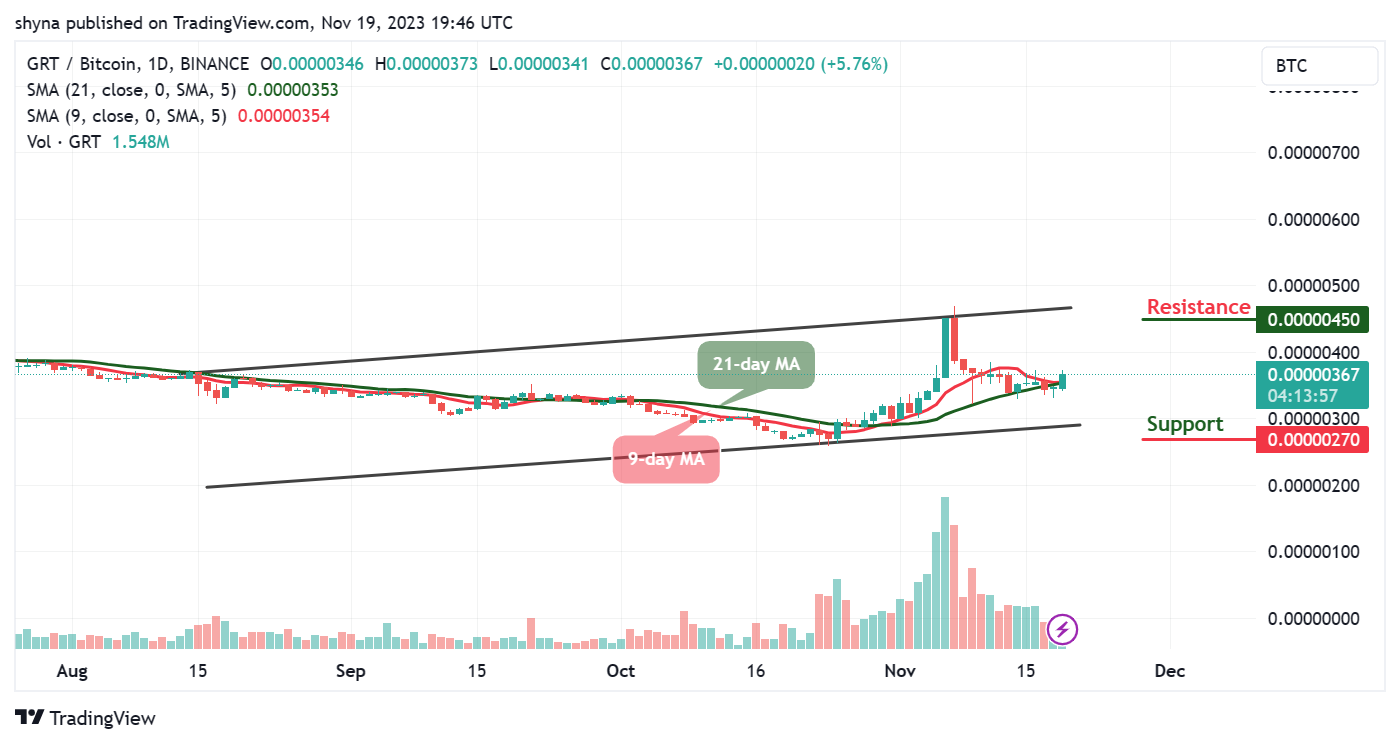
However, if the Graph price slides below the moving averages, GRT/BTC may likely cross below the lower boundary of the channel to hit the support level of 270 SAT and below. Moreover, any bullish movement near the upper boundary of the channel may allow the market to form a new upward trend and this could reach the potential resistance at 450 SAT and above.
The Graph Alternatives
Looking at the daily chart, the Graph price is likely to create additional gains. However, if the Graph price continues to follow the upward movement, traders can expect a bullish cross above the upper boundary of the channel. Aside from today’s little gain, the Graph price is still maintaining a bullish movement and traders can expect the coin to cross above the channel for it to create additional gains.
Nevertheless, while The Graph (GRT) stands as a well-established cryptocurrency with a reputation for stability, Bitcoin Minetrix (BTCMTX) is currently in its presale stage, having already secured an impressive $4.2 million. Investors are advised to weigh the distinctive characteristics of each: The Graph (GRT) offers a steady and established path for returns; this potential is further bolstered by the substantial funds raised during its presale.
New Crypto Mining Platform – Bitcoin Minetrix

- Audited By Coinsult
- Decentralized, Secure Cloud Mining
- Earn Free Bitcoin Daily
- Native Token On Presale Now – BTCMTX
- Staking Rewards – Over 100% APY
Join Our Telegram channel to stay up to date on breaking news coverage
Credit: Source link


")

 Slips to $63K (Weekend Watch)")


 Bitcoin
  Ethereum
  Tether
  BNB
BNB  Solana
  USDC
USDC  XRP
XRP  Dogecoin
  Toncoin
  Cardano
  Shiba Inu
  Avalanche
  Wrapped Bitcoin
  Bitcoin Cash
  Polkadot
  NEAR Protocol
  Polygon
  Litecoin
  Uniswap
  LEO Token
  First Digital USD
  Hedera
  Aptos
Aptos  Stellar
  Cosmos Hub
  Filecoin
  OKB
OKB  Render
  Immutable
  Pepe
Pepe  XT.com
  Bittensor
  Arbitrum
  dogwifhat
  Maker
Maker  Wrapped eETH
  The Graph
  Optimism