Join Our Telegram channel to stay up to date on breaking news coverage
The Tron price prediction shows that TRX is down by 0.62% in the last few hours as the coin touches the support level of $0.075.
Tron Prediction Statistics Data:
- Tron price now – $0.076
- Tron market cap – $6.8 billion
- Tron circulating supply – 89.3 billion
- Tron total supply – 89.3 billion
- Tron Coinmarketcap ranking – #10
TRX/USD Market
Key Levels:
Resistance levels: $0.085, $0.087, $0.089
Support levels: $0.068, $0.066, $0.064
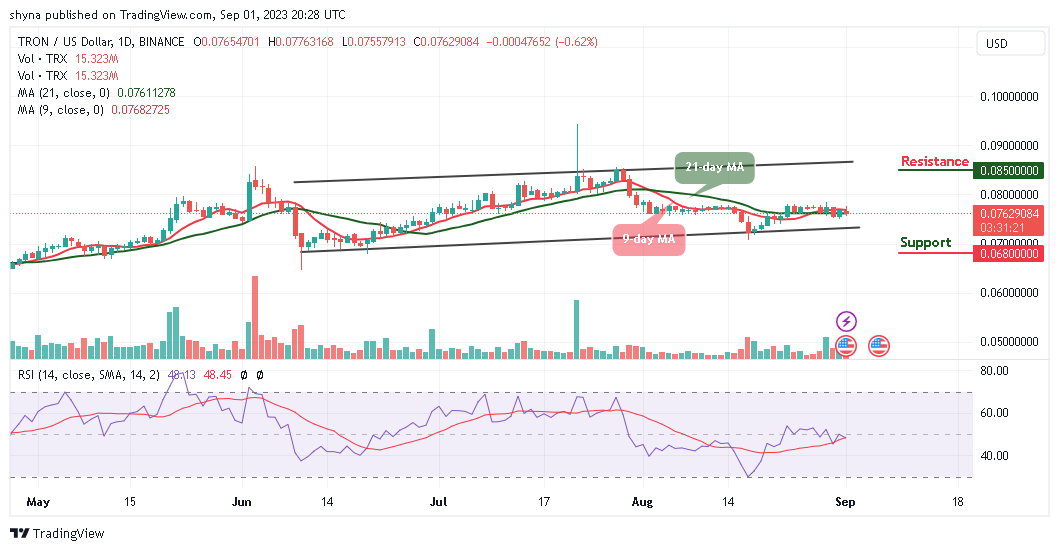
TRX/USD touches the daily high at $0.077 before giving a bearish signal at the time of writing, the coin is likely to slide below the 9-day and 21-day moving averages as the technical indicator Relative Strength Index (14) heads to the downside. Meanwhile, a break below the support level of $0.075 could give the market enough strength to dig dip.
Tron Price Prediction: Price May Nosedive Below $0.075 Support
The Tron price is showing a sign of weakness as the coin is down by 0.62%, reflecting a price drop in the market. Meanwhile, the fall might become heavy if the bearish action continues within the channel. However, since the Tron price is moving bearishly, traders can expect the trend to keep advancing lower if the price actions slide below the moving averages.
Meanwhile, a breakout to the upside could strengthen the bulls and push the price to the resistance levels of $0.085, $0.087, and $0.089. Moreover, any breakdown might lead the market in a bearish scenario if the price heads to the south, it could also reach the supports at $0.068, $0.066, and $0.064.
TRX/BTC Heads to the North
Against BTC, the Tron price is yet to cross above the upper boundary of the channel as the coin crosses above the 9-day moving average. On the contrary, if the selling pressure returns, the Tron (TRX) may create another low. At the moment, the technical indicator Relative Strength Index (14) is hovering above the 60-level, suggesting that the market may follow a sideways movement.
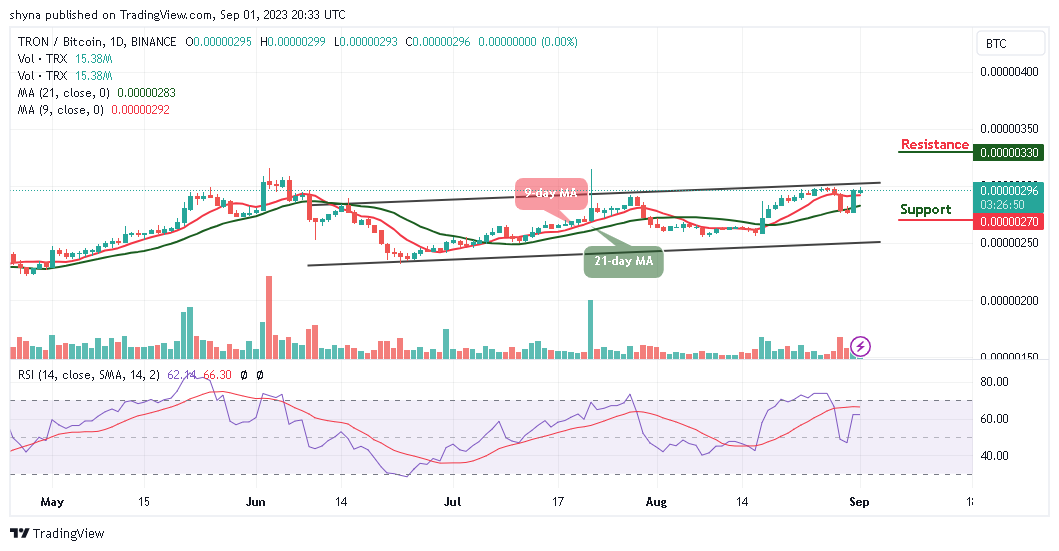
Nevertheless, the Tron (TRX) is currently hovering at 296 SAT, and if the coin crosses below the 9-day and 21-day moving averages, traders may expect close support at 270 SAT and below. But, if the bullish movement continues and breaks above the channel, traders can then confirm a bull run for the market, and the nearest resistance level could be located at 330 SAT and above.
Alternatives to Tron
The Tron price is seen moving in a narrow trading range after a bullish rally failed to materialize. The early daily rally toward the $0.078 level failed to generate sustainable gains, with TRX/USD trading within the 9-day and 21-day moving averages.
That being said, in the context of $WSM, there are no team tokens. Wall Street Memes has a vibrant and thriving community, and the wisest course of action is to acquire the token now, not at a later time. Concurrently, the token has already gathered over $25 million as the countdown to its official launch progresses.
Wall Street Memes – Next Big Crypto

- Early Access Presale Live Now
- Established Community of Stocks & Crypto Traders
- Featured on BeInCrypto, Bitcoinist, Yahoo Finance
- Rated Best Crypto to Buy Now In Meme Coin Sector
- Team Behind OpenSea NFT Collection – Wall St Bulls
- Tweets Replied to by Elon Musk
Join Our Telegram channel to stay up to date on breaking news coverage
Credit: Source link


 Slips to $63K (Weekend Watch)")


 Bitcoin
  Ethereum
  Tether
  BNB
BNB  Solana
  USDC
USDC  XRP
XRP  Dogecoin
  Toncoin
  Cardano
  Shiba Inu
  Avalanche
  Wrapped Bitcoin
  Bitcoin Cash
  Polkadot
  NEAR Protocol
  Polygon
  Litecoin
  Uniswap
  LEO Token
  First Digital USD
  Hedera
  Aptos
Aptos  Stellar
  Cosmos Hub
  Filecoin
  OKB
OKB  Render
  Immutable
  XT.com
  Pepe
Pepe  Arbitrum
  Bittensor
  Maker
Maker  dogwifhat
  Wrapped eETH
  The Graph
  Optimism