
Join Our Telegram channel to stay up to date on breaking news coverage
The Tron price prediction shows that TRX is beginning to restart the uptrend after trading below the 9-day and 21-day moving averages.
Tron Prediction Statistics Data:
- Tron price now – $0.085
- Tron market cap – $7.6 billion
- Tron circulating supply – 89.7 billion
- Tron total supply – 89.7 billion
- Tron Coinmarketcap ranking – #10
TRX/USD Market
Key levels:
Resistance Levels: $0.100, $0.110, $0.120
Support Levels: $0.070, $0.060, $0.050
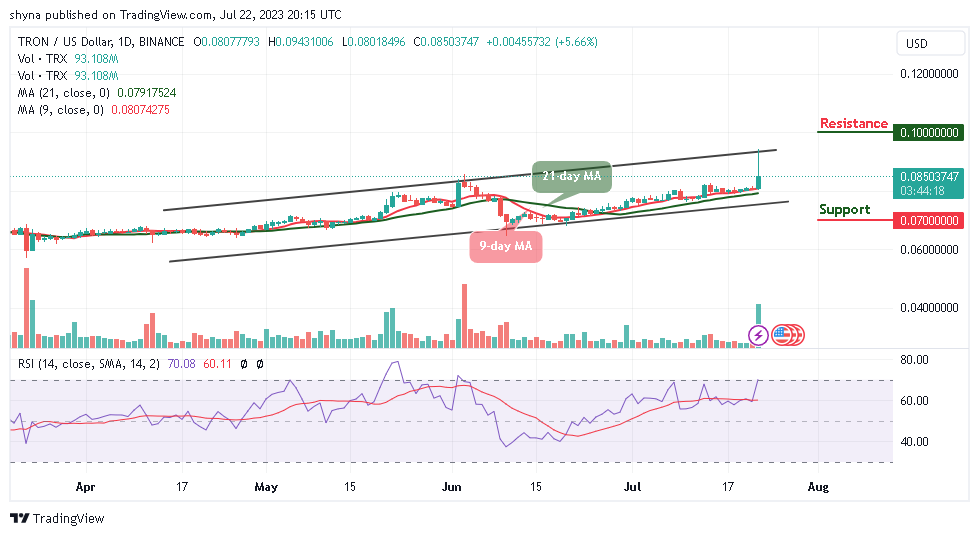
TRX/USD heads to the north today as the price spikes above the resistance level of $0.090. However, a positive cross above the upper boundary of the channel may increase the Tron price to $0.095 resistance. However, traders should note that a consistent price increase may bring more buyers into the market as bulls increase their positions.
Tron Price Prediction: Price May Begin to Break Higher
The Tron price is already making a positive move toward the upper boundary of the channel; crossing above this barrier could confirm the bullish movement for the coin. Moreover, the daily chart reveals that if the 9-day moving average remains above the 21-day moving average, the coin will begin to move to the upside. Meanwhile, the bears could take advantage of the current market value if they step back into the market.
On the same note, the technical indicator Relative Strength Index (14) is moving to cross into the overbought region, which shows that the market is ready for the upside. Nevertheless, if the Tron price crosses above the upper boundary of the channel, it could hit the resistance levels at $0.100, $0.110, and $0.120 but facing the south may bring the price to the supports at $0.070, $0.060, and $0.050 respectively.
Against Bitcoin, the Tron price is hovering above the 9-day and 21-day moving averages. However, the intraday trading is ranging as the coin stays above the moving averages, any bullish movement above the upper boundary of the channel could reach the resistance level at 350 SAT and above.
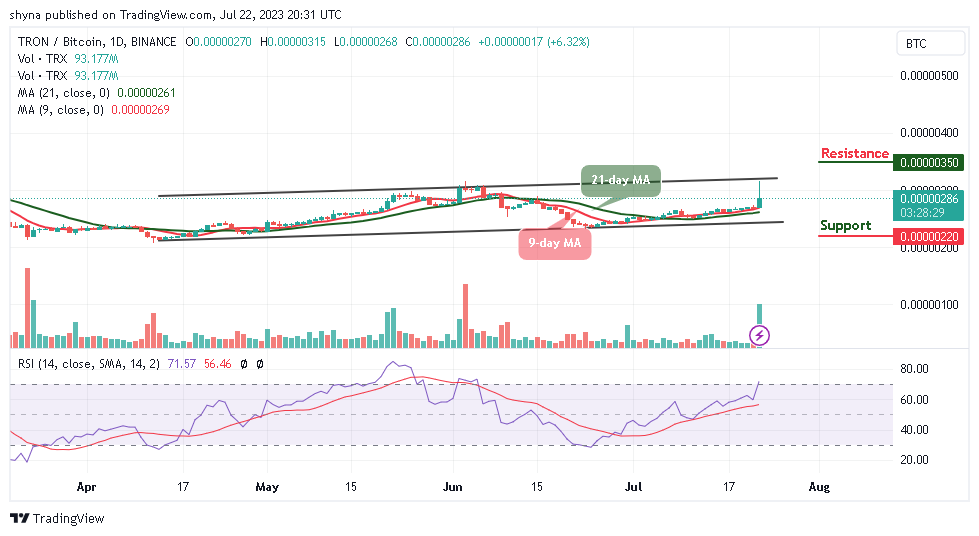
Therefore, if the sellers bring the market to the south, traders can expect a fall below the lower boundary of the channel, and breaking below this barrier may touch the support at 220 SAT and below. Meanwhile, at the moment, the technical indicator Relative Strength Index (14) is moving to cross above the 70-level, suggesting bullish movement.
Tron Alternatives
The Tron price continues to trade above the 9-day and 21-day moving averages within the channel. The cryptocurrency is trying to create a higher ground above the resistance level of $0.110, and should the buyers keep the coin above the moving averages, it may remain on the upside.
However, Since launching its presale in late May at wallstmemes.com, the new meme coin project has raised close to $17 million and attracted attention from some of the biggest names in crypto. Therefore, interested investors are encouraged to invest in Wall Street Memes before the expiration of the presale stage.
Wall Street Memes – Next Big Crypto

- Early Access Presale Live Now
- Established Community of Stocks & Crypto Traders
- Featured on BeInCrypto, Bitcoinist, Yahoo Finance
- Rated Best Crypto to Buy Now In Meme Coin Sector
- Team Behind OpenSea NFT Collection – Wall St Bulls
- Tweets Replied to by Elon Musk
Join Our Telegram channel to stay up to date on breaking news coverage
Credit: Source link


 Bitcoin
  Ethereum
  Tether
  BNB
BNB  Solana
  USDC
USDC  XRP
XRP  Dogecoin
  Toncoin
  Cardano
  Shiba Inu
  Avalanche
  Wrapped Bitcoin
  Bitcoin Cash
  Polkadot
  NEAR Protocol
  Polygon
  Litecoin
  Uniswap
  LEO Token
  First Digital USD
  Aptos
Aptos  Hedera
  Stellar
  Filecoin
  Cosmos Hub
  OKB
OKB  Render
  XT.com
  Immutable
  Pepe
Pepe  Arbitrum
  Bittensor
  Maker
Maker  Optimism
  dogwifhat
  Wrapped eETH
  The Graph
