
The U.S. Treasury yields have recently been flashing warning signs. These yields, representing the return on investment for U.S. government bonds, serve as a crucial barometer of market sentiment and overall economic vitality.
An area of particular interest in this context is the spread between the 10-year Treasury yield and the 3-month Treasury yield. This spread, representing the difference between the returns on long-term and short-term investments, is a significant indicator of future economic prospects.
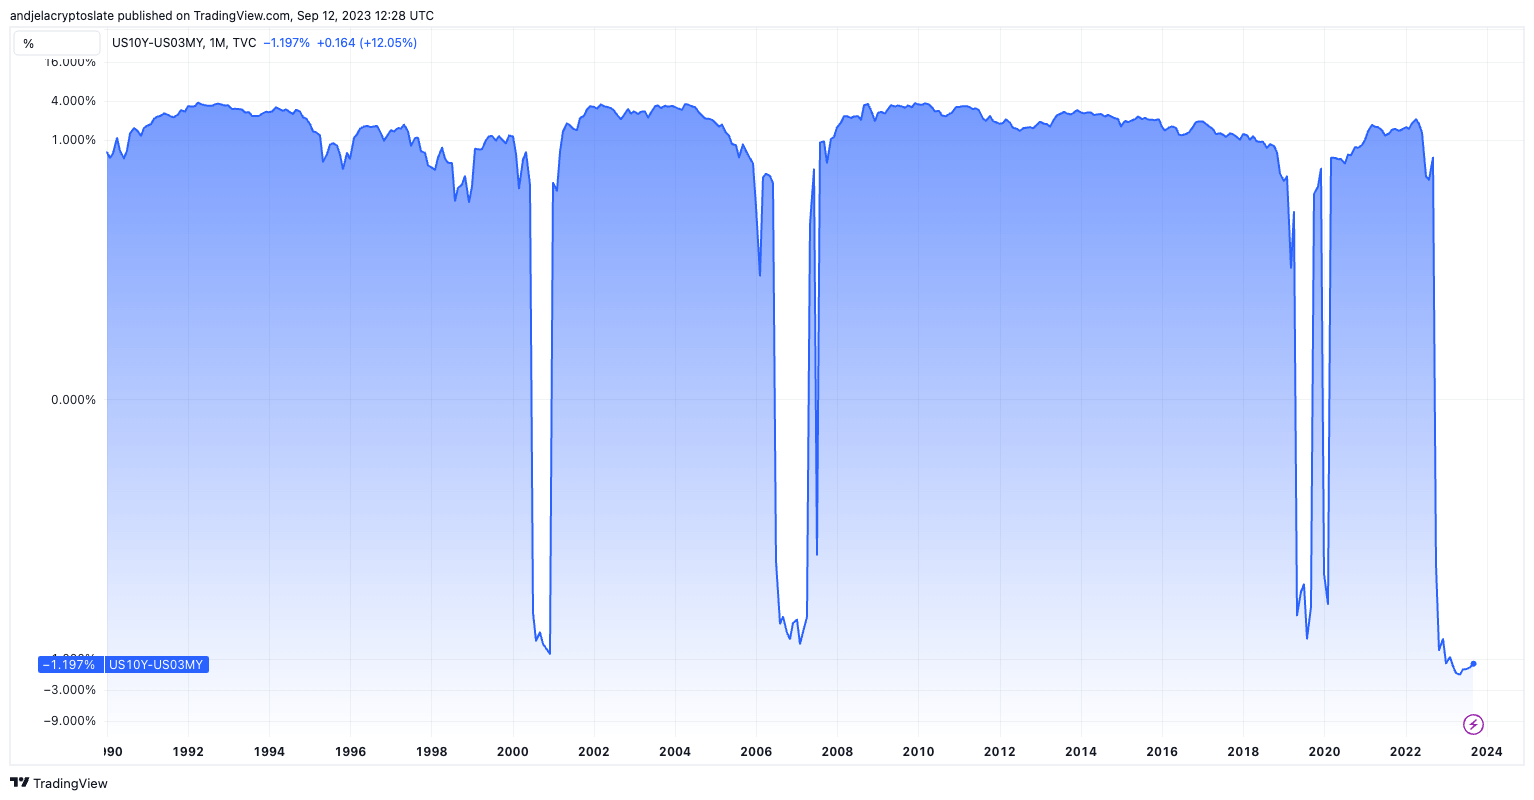
Historically, the spread between the 10-year and 3-month Treasury yields has been a reliable harbinger of economic downturns.
A positive spread typically indicates investor confidence in the economy’s long-term prospects, while a negative spread, or an “inverted yield curve,” often precedes recessions. This inversion suggests that investors are more confident in the short-term outlook than the long-term, prompting them to seek longer-term securities despite the lower yields.
Past instances of this inversion have consistently correlated with economic recessions. The phenomenon was evident before the recessions of the early 1980s, 1990s, the early 2000s dot-com boom, and, notably, the 2007-2008 financial crisis. The predictive power of this spread, rooted in decades of financial data, underscores its importance in economic forecasting.
In addition to its predictive power, the yield spread has been employed to calculate the probability of impending recessions. According to a 1996 research paper from the Federal Reserve Bank of New York, the spread between the 10-year and 3-month Treasury yields can derive a model-based probability of a recession in the United States over the next 12 months. This model, historically aligned closely with actual recessions, offers a quantitative approach to gauging economic downturn risks.
By inputting the current spread value into the model, analysts can obtain a percentage likelihood of a recession occurring within the following year.
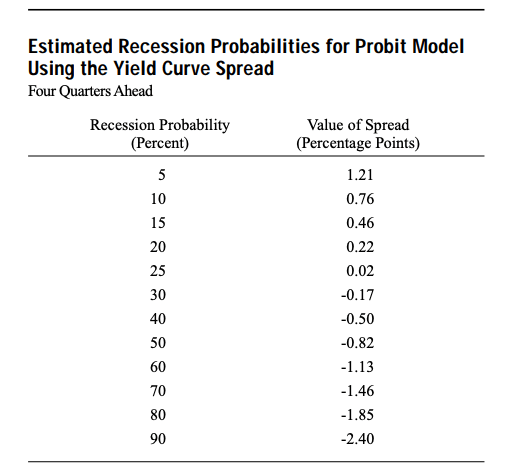
October 2022 saw the spread turning negative, a development that raised eyebrows in financial circles. By May 2023, this spread plummeted to an all-time low of -1.88%. As of Sep. 10, it stands at a concerning -1.26%, with market analysts and investors on high alert. The Federal Reserve’s recession probability model suggests a heightened recession probability, ranging from 60% to 70%.
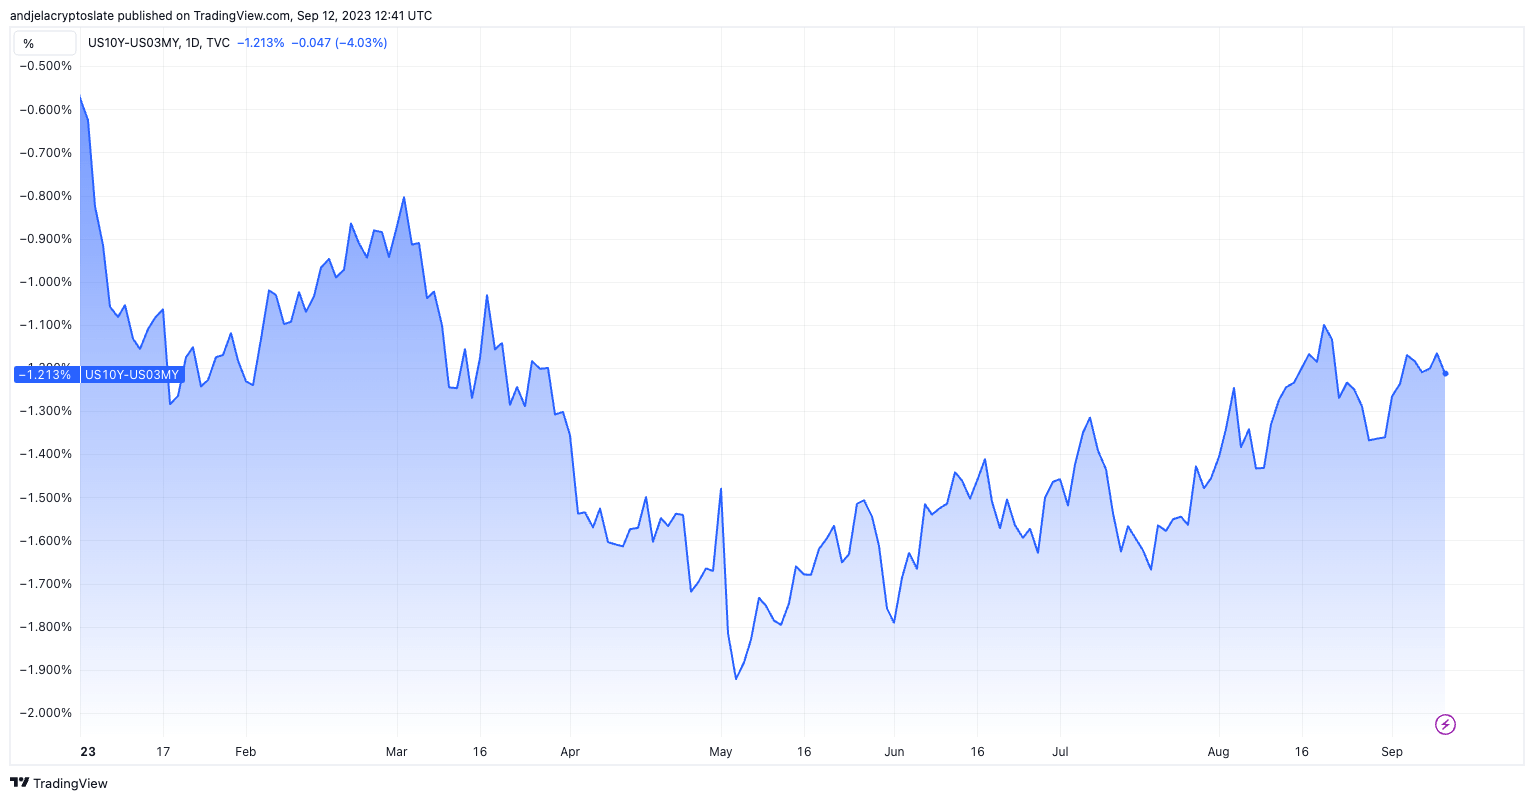
A particularly large negative spread, such as the current one, indicates a lack of confidence in the long-term economic outlook. Investors, wary of future prospects, are flocking to longer-term securities, even if it means settling for lower returns. This behavior suggests a collective anticipation of economic headwinds in the not-so-distant future.
The post U.S. Treasury yield spread dips to historic lows signaling economic caution appeared first on CryptoSlate.
Credit: Source link


 Bitcoin
  Ethereum
  Tether
  BNB
BNB  Solana
  USDC
USDC  XRP
XRP  Dogecoin
  Toncoin
  Cardano
  Shiba Inu
  Avalanche
  Wrapped Bitcoin
  Polkadot
  Bitcoin Cash
  NEAR Protocol
  Polygon
  Litecoin
  Fetch.ai
  Uniswap
  LEO Token
  Hedera
  Aptos
Aptos  First Digital USD
  Render
  Cosmos Hub
  Pepe
Pepe  Filecoin
  dogwifhat
  Immutable
  Stellar
  Wrapped eETH
  XT.com
  Bittensor
  OKB
OKB  Optimism
  Arbitrum
  The Graph
  Maker
Maker 
