
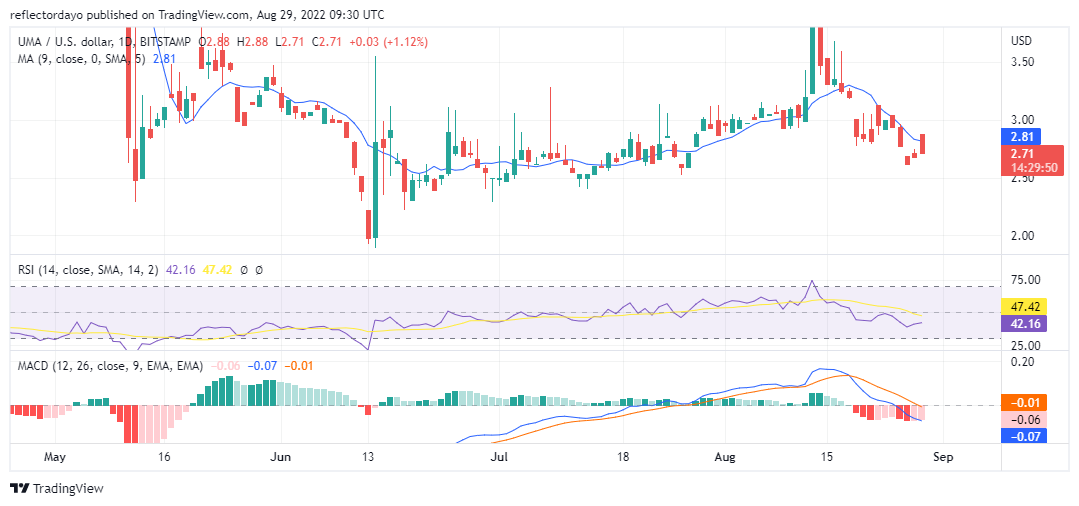
In Today’s daily UMA/USD trading session, buyers drove the price above the 9-day moving average. This initially gave us the impression that the buyers will take control of the market as they make the market rise by 1.02%. Not too far into the day, the table turned in favour of the sellers. They drove the market down from the height at which the buyers have taken it. Now they have brought the price back to yesterday’s closing price. The outlook of today’s candlestick is that of a strong bullish candlestick.
Universal Market Price Statistic:
- UMA/USD price now: $2.70000
- IMX/USD market cap: $ 191,345,101
- IMX/USD circulating supply: 68,756,905.64
- IMX/USD total supply: 108,668,058
- IMX/USD coin market ranking: #134
Key Levels
- Resistance: $2.870000, $3.030000, $3.130000
- Support: $2.590000, $2.410000, $2.270000
Buy Universal Market Now
Your capital is at risk

Universal Market Price Analysis: Market Indecision
Over a longer timeframe, the market ranges sideways. Buyers and sellers are in conquest to take control of the market. But the behaviour of the market changed on the 14th of August when selling pressure sent the price to the sky. Then selling pressure brought the market low in the same manner on the following day, the 16th of August. Before this, that ranging market was slightly favouring bulls over a long period as the market activities imply. After the market swing on the 14th and 15th, the market resumes a sideway range. But this one now favour bears as sellers show more strength than the buyers.
Universal Market Price Analysis: The Indicators Point of View
Before the 14th and 15th market swings, the RSI line oscillated in a regular-ranging pattern. And because the market slightly favoured the buyers, the line rises steadily until it entered the upper zone of the indicator. But, the indicator, at the moment, now ranges at 42% market strength. And this supports a downtrend.
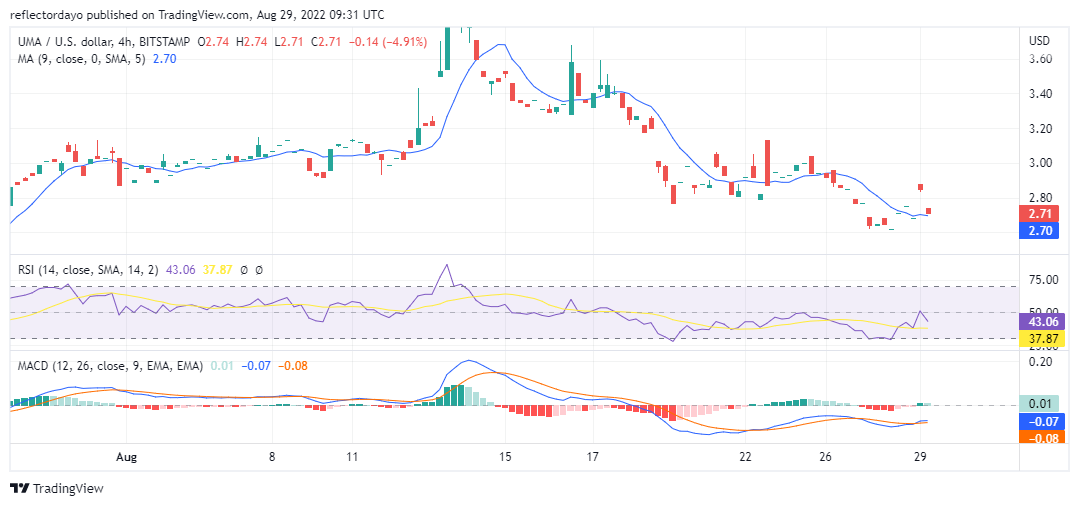
Universal Market Price Analysis: UMA/USD 4-Hour Chart Outlook
In the four-hour chart, we can see that the trading session of yesterday, is a flat market with the appearance of the ‘4 price doji’s’. This is a sign of unresponsiveness in the market. And Out of the 6 sessions of yesterday’s 4-hour chart, only three sessions appeared on the chart. Some of the remaining sessions do not appear. Both the RSI and the MACD of the 4-hour session show that the market is returning to the downside.
Related
Tamadoge – Play to Earn Meme Coin

- Earn TAMA in Battles With Doge Pets
- Capped Supply of 2 Bn, Token Burn
- NFT-Based Metaverse Game
- Presale Live Now – tamadoge.io
Credit: Source link


")


 Price:A Recovery Or Short-Term Relief?")


 Bitcoin
  Ethereum
  Tether
  BNB
BNB  Solana
  USDC
USDC  XRP
XRP  Dogecoin
  Toncoin
  Cardano
  Shiba Inu
  Avalanche
  Wrapped Bitcoin
  Polkadot
  Bitcoin Cash
  NEAR Protocol
  Polygon
  Litecoin
  Uniswap
  Fetch.ai
  LEO Token
  Aptos
Aptos  Hedera
  First Digital USD
  Pepe
Pepe  Cosmos Hub
  dogwifhat
  Filecoin
  Render
  Stellar
  Immutable
  XT.com
  Optimism
  OKB
OKB  Bittensor
  Arbitrum
  Wrapped eETH
  Maker
Maker  The Graph
