
The financial world relies heavily on indicators to gauge market sentiment and predict future trends. Among these, the Volatility Index, commonly known as the VIX, stands out as a prominent measure of market anxiety.
Originating from the Chicago Board Options Exchange, the VIX is an index that represents the market’s expectation of 30-day forward-looking volatility. Calculated from the implied volatilities of a wide range of S&P 500 index options, a high VIX typically signals heightened investor fears, while a low reading suggests a calm market.
On the other hand, the S&P 500 Index, or SPX, serves as a beacon for the overall health of the U.S. stock market. Comprising 500 of the largest U.S. companies by market capitalization, its movements are watched closely by traders, analysts, and institutional investors alike. Historically, the VIX and the SPX have shared an inverse relationship: as the SPX rises, indicating bullish sentiment, the VIX usually decreases, suggesting reduced market anxiety, and vice versa.
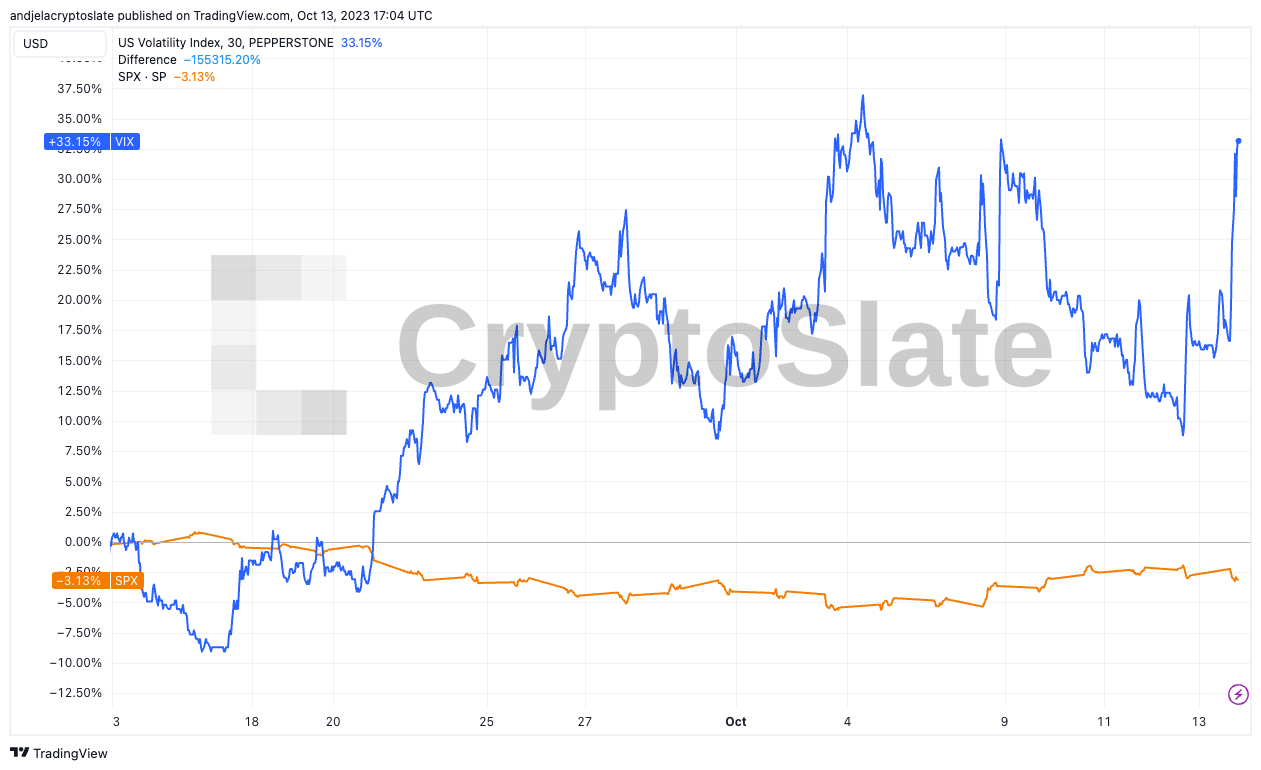
Yet, recent market data paints an unusual picture. Over 3 months, the SPX witnessed a decline of 3.37%, a clear indication of some bearish sentiment. However, the VIX skyrocketed during the same period, increasing 38.41%.
This divergence is also observed in a narrower 1-month window: the SPX declined by 3%, while the VIX surged by 32.8%.
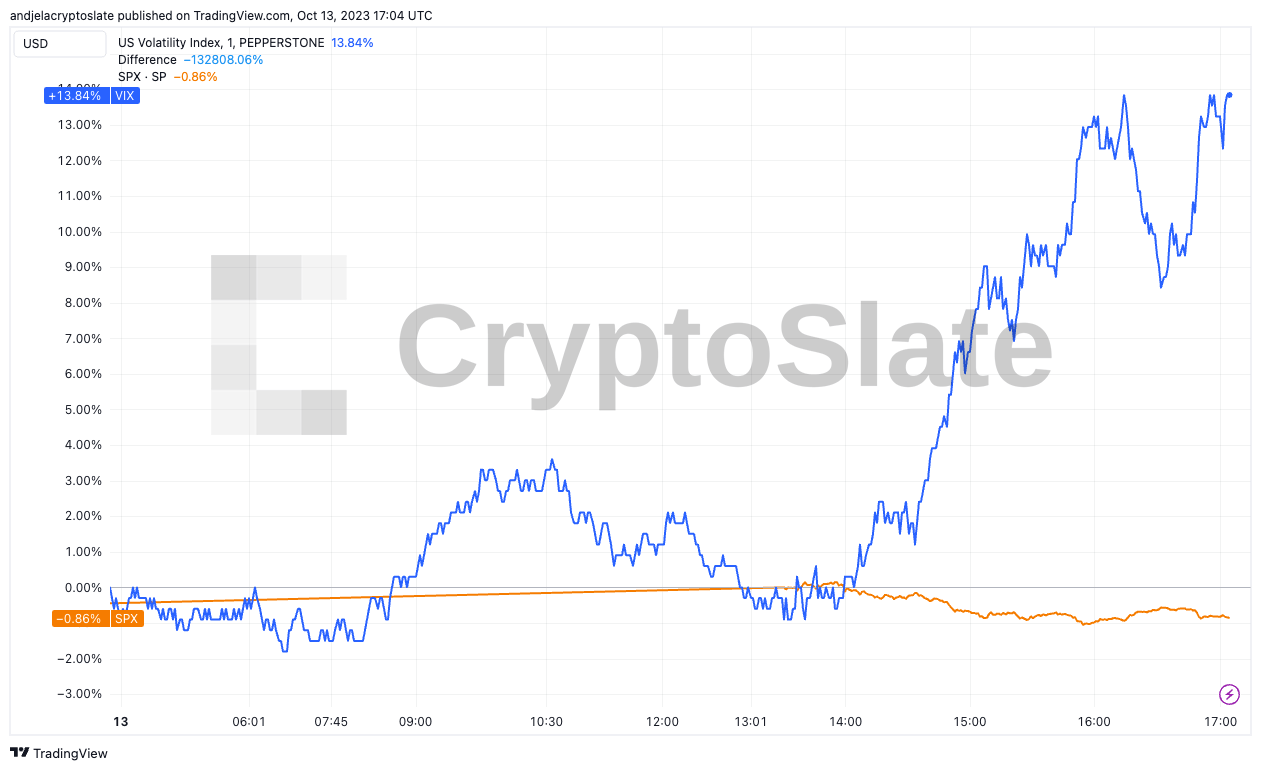
The discrepancy on Oct. 13 was even more pronounced — in just a single trading day, the VIX jumped by an alarming 13.54%. Meanwhile, the SPX, rather than reflecting this spike in volatility, remained almost unchanged, registering a mere 0.82% dip.
This stark divergence prompts questions. Several factors could be contributing to this anomaly. Firstly, the market might be anticipating significant future movements in the SPX that aren’t yet reflected in its current value. Secondly, external events or geopolitical tensions could impact market derivatives more than the cash market, leading to an exaggerated VIX. Lastly, structural changes or shifts in market dynamics and participants could alter the traditional relationship between the two indices.
For investors and market participants, such discrepancies are cause for vigilance. While the VIX’s primary role is to measure market sentiment, its current dislocation from the SPX may indicate underlying market stresses or potential forthcoming volatility. Traders might interpret this as a sign to hedge their positions or prepare for potential market swings.
The post VIX surges while SPX remains steady: What’s behind the anomaly? appeared first on CryptoSlate.
Credit: Source link


 Bitcoin
  Ethereum
  Tether
  BNB
BNB  Solana
  USDC
USDC  XRP
XRP  Dogecoin
  Toncoin
  Cardano
  Shiba Inu
  Avalanche
  Wrapped Bitcoin
  Polkadot
  Bitcoin Cash
  NEAR Protocol
  Polygon
  Litecoin
  Fetch.ai
  Uniswap
  LEO Token
  Render
  Hedera
  First Digital USD
  Aptos
Aptos  Cosmos Hub
  Pepe
Pepe  Filecoin
  Immutable
  Stellar
  Wrapped eETH
  XT.com
  OKB
OKB  dogwifhat
  Bittensor
  Optimism
  Arbitrum
  The Graph
  Maker
Maker 
