
eCASH (XEC) Price Prediction – May 27
The XEC/USD market operation resumes ranging after a rebound from the recent fearful downing motion. It has statically gathered that the crypto economy records an all-time low of $0.0000173 and an all-time high of $0.0005926 as it trades around 4.19% negatives.
eCASH (XEC) Price Statistics:
XEC price now – $0.00004607
XEC market cap – $877.7 million
XEC circulating supply – 19.1 trillion
XEC total supply – 18.9 trillion
Coinmarketcap ranking – #55
XEC/USD Market
Key Levels:
Resistance levels: $0.00006, $0.0000, $0.00007, $0.00008
Support levels: $0.00003, $0.00002, $0.00001
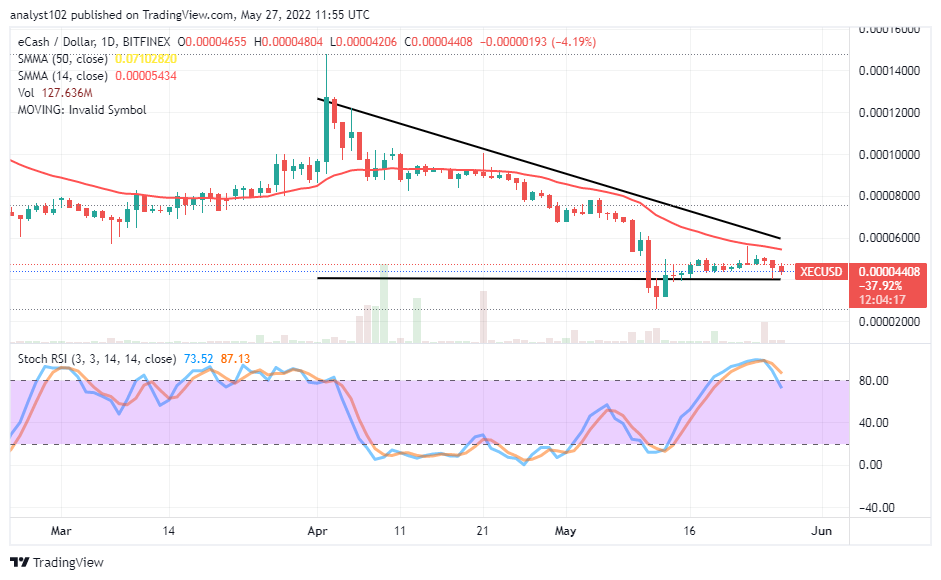 XEC/USD – Daily Chart
The daily chart reveals the crypto-economic price resumes ranging after a rebound underneath the trend line of the 14-day SMA. The bearish trend line drew above the trading SMA indicator to serve as a resistant-backing tool, showcasing the southward path that price keeps over time. The Stochastic Oscillators are in the overbought region, trying to cross southward against the 80 range. That indicates the US Dollar is striving to suppress that of the crypto in the near time.
Will the XEC/USD trade down again to surpass the previous low point?
It is possible the XEC/USD trade down again to surpass the previous low point while bulls fail to hold firm against any possible fearful corrections that can be posed by bears’ actions beneath the trend line of the 14-day SMA afterward. On the bill of slight note to negate that assumption, the situation will enable long-position takers to find a stance to build up support to swing upward smoothly.
On the downside of the technical analysis, the XEC/USD market sellers have every tendency to get repositioned underneath the $0.00006 resistance level. As it is apparent that a bearish-trading cycle has overwhelmed some ups going by the reading of the Stochastic Oscillators, it would be ideal that the price is allowed to get down to the bottom of lower-trading support before reconsidering a buying order.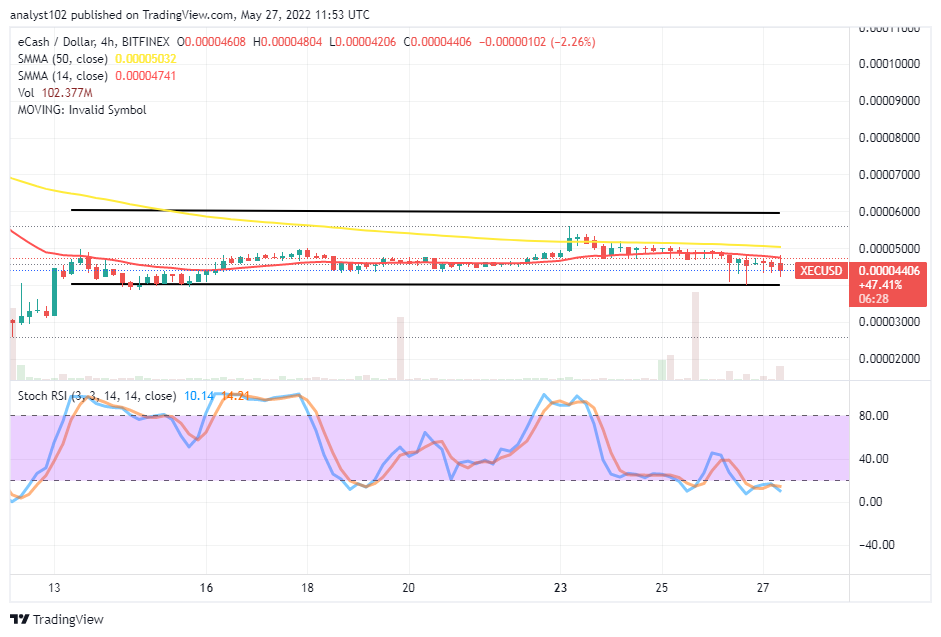
XEC/USD 4-hour Chart
The XEC/USD 4-hour chart showcases the crypto-economic price resumes ranging after a rebound. The upper range line drew at the $0.00006 resistance level, and the lower range line drew at the $0.00004 support level. The 14-day SMA indicator is underneath the 50-day SMA indicator. And they are within the range-bound zones as well-defined. The Stochastic Oscillators are swinging around the ranges of 40 and 20. Also, they are making efforts to touch an area briefly in the oversold region. All of those scenarios suggest the base crypto is under depression as paired with the trending valuation of the US Dollar.
eToro – Our Recommended Trading Platform

- CySEC, FCA & ASIC regulated – Trusted by Millions of Users
- Trade Crypto, Forex, Commodities, Stocks, Forex, ETFs
- Free Demo Account
- Deposit via Debit or Credit card, Bank wire, Paypal, Skrill, Neteller
- Copytrade Winning Traders – 83.7% Average Yearly Profit
68% of retail investor accounts lose money when trading CFDs with this provider.
Read more:
Credit: Source link


 As ‘Next Amazon’: Price Targets")
")


 Bitcoin
  Ethereum
  Tether
  BNB
BNB  Solana
  USDC
USDC  XRP
XRP  Dogecoin
  Toncoin
  Cardano
  Shiba Inu
  Avalanche
  Wrapped Bitcoin
  Polkadot
  Bitcoin Cash
  NEAR Protocol
  Polygon
  Litecoin
  LEO Token
  Uniswap
  Fetch.ai
  Render
  First Digital USD
  Hedera
  Aptos
Aptos  Cosmos Hub
  Pepe
Pepe  Filecoin
  Wrapped eETH
  Stellar
  OKB
OKB  Immutable
  dogwifhat
  Optimism
  Arbitrum
  Bittensor
  The Graph
  Arweave
