
The Ripple price prediction keeps moving below the moving averages as the coin heads toward the lower boundary of the channel.
XRP/USD Market
Key Levels:
Resistance levels: $0.85, $0.90, $0.95
Support levels: $0.50, $0.45, $0.40
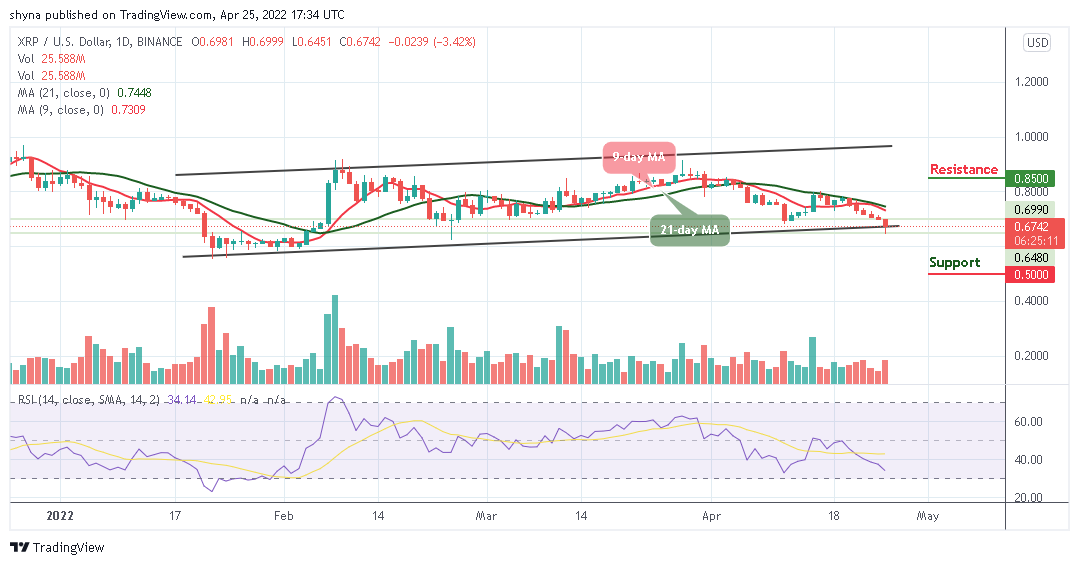
XRP/USD is ready to create more downtrends as the coin moves to cross below the lower boundary of the channel. The coin may likely revisit the $0.65 support before it could start a new increase. According to the technical indicator, the coin may hit the nearest support at $0.60 to move into a short-term bearish zone.
Ripple Price Prediction: Ripple (XRP) Heads to the South
At the time of writing, the Ripple price is currently exchanging hands at $0.67, and any attempt to make it cross below $0.65 may likely open the doors for more downsides, and the price could spike below the $0.60 support level. However, traders may need to keep their eyes on the $0.55 before creating additional bearish signals at the support levels of $0.50, $0.45, and $0.40.
Nevertheless, traders may experience a quick buy once the trade reaches the support at $0.70, and a bullish movement is likely to trigger buying opportunities for the market, which might cause the price to reach the resistance levels at $0.85, $0.90, and $0.95. Meanwhile, the technical indicator Relative Strength Index (14) is likely to return into the oversold territory as the signal line heads to the south.

Against Bitcoin, the Ripple (XRP) moves at the downside within the channel. If the selling pressure persists, the Ripple price may bring a new low into the market. Presently, the technical indicator Relative Strength Index (14) is moving towards the oversold region; more negative moves may come to play as the pair moves near the lower boundary of the channel.
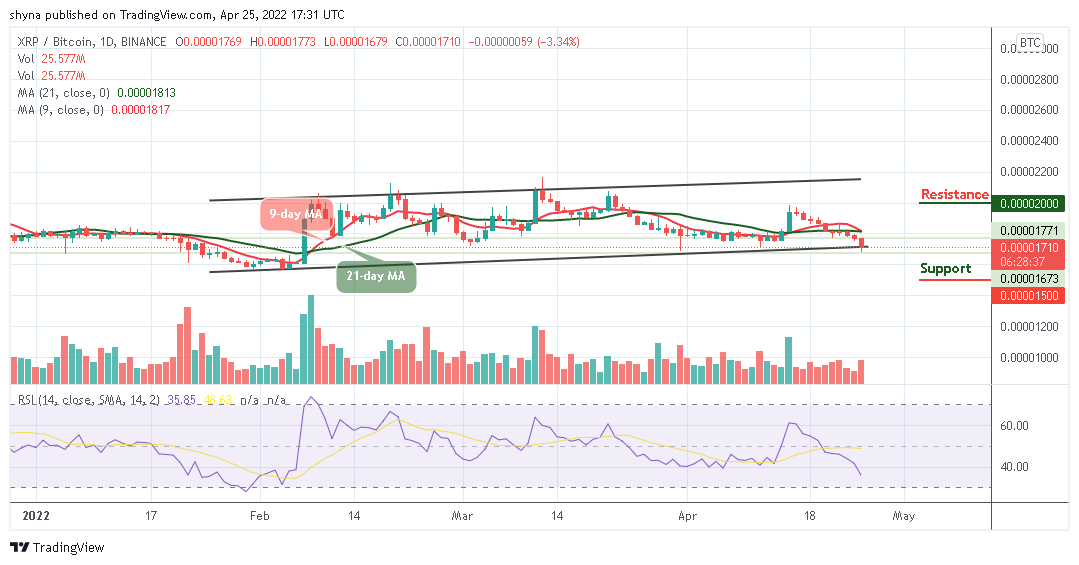
However, traders may expect close support at 1700 SAT before breaking to 1500 SAT and below. If a bullish movement surfaces, validating a break above the 9-day and 21-day moving averages may confirm a bullish movement for the market, and the nearest resistance level may be located at 2000 SAT and above.
Looking to buy or trade Ripple (XRP) now? Invest at eToro!
68% of retail investor accounts lose money when trading CFDs with this provider
Credit: Source link


 Declines 35% In One Month To 15-Month Lows")
 price risen by more than 320% in two weeks?")


 Bitcoin
  Ethereum
  Tether
  BNB
BNB  Solana
  USDC
USDC  XRP
XRP  Dogecoin
  Toncoin
  Cardano
  Shiba Inu
  Avalanche
  Polkadot
  Wrapped Bitcoin
  Bitcoin Cash
  NEAR Protocol
  Polygon
  Litecoin
  Uniswap
  Fetch.ai
  LEO Token
  Hedera
  First Digital USD
  Aptos
Aptos  Cosmos Hub
  Pepe
Pepe  Filecoin
  Immutable
  Stellar
  Render
  XT.com
  OKB
OKB  Optimism
  dogwifhat
  Arbitrum
  Bittensor
  Maker
Maker  Wrapped eETH
  The Graph
