
Ripple Price Prediction – November 12
The Ripple price prediction shows that XRP is lacking imminent support within the market and the coin may continue to trade in the red.
XRP/USD Market
Key Levels:
Resistance levels: $1.40, $1.45, $1.50
Support levels: $1.00, $0.95, $0.90
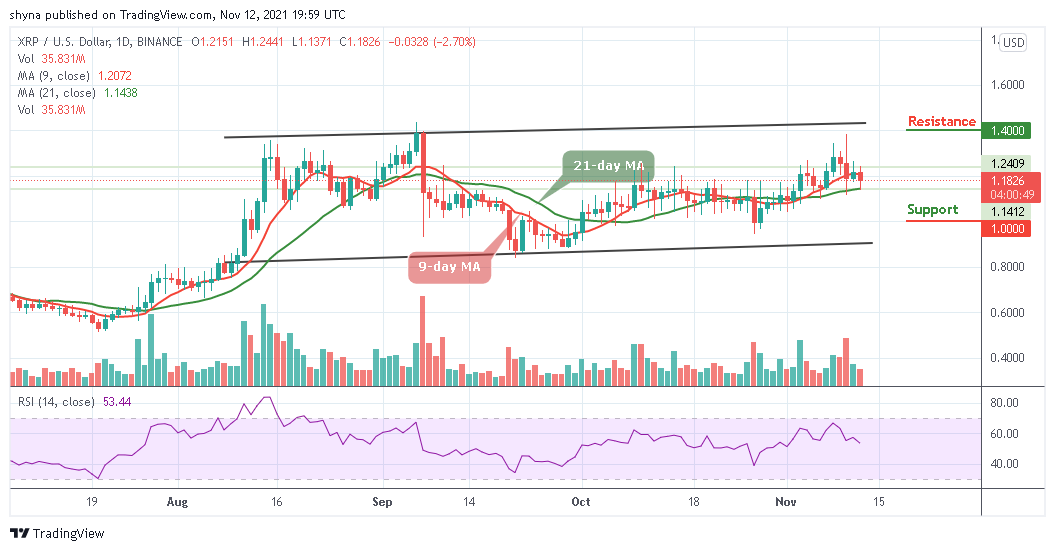
At the time of writing, XRP/USD is now correcting downwards after touching the resistance level of $1.18. However, the Ripple price may cross below the 9-day and 21-day moving averages if the coin failed to rebound. Currently, the Ripple price is exhibiting an intraday dip and bearish move alongside with the lack of support.
Ripple Price Prediction: Ripple Price Could Fall More
The daily chart reveals that the Ripple Price is seen correcting downwards after having touching the $1.06 resistance but unable to hit the higher resistance. The coin is now moving towards the major support at $1.10 but hovering around $1.18 support. However, the moment the coin rightly gains the required momentum, it is ought to bounce back and retest the formed resistance.
At the moment, the technical indicator Relative Strength Index (14) faces the south with its signal lines pointing down. Should the bulls prevail over the bears by bringing the price back above the 9-day and 21-day moving averages; XRP/USD may rally towards the $1.40, $1.45, and $1.50 resistance levels. In other words, if the bears continue to push the price below the moving averages; the price could find its low at the support levels of $1.00, $0.95, and $0.90 respectively.

When compares with Bitcoin, the Ripple (XRP) continue to consolidate below the 9-day and 21-day moving averages as the coin is yet to slum below the lower boundary of the channel. On the contrary, the Ripple bulls may try to step back into the market. During the European Session today, the coin touches the resistance level of 1900 SAT, traders can expect a price rise to the resistance level of 2000 SAT and above.
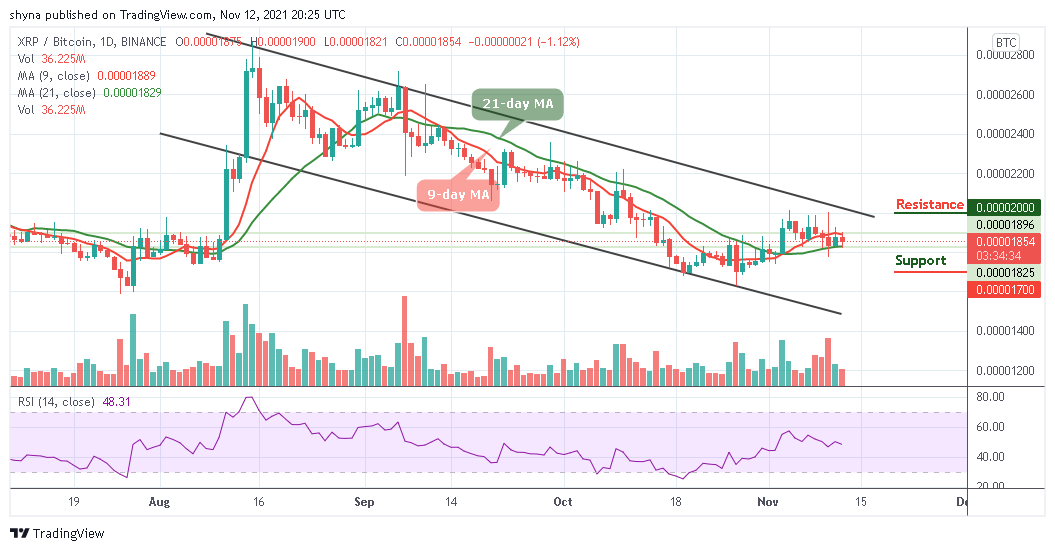
However, if the sellers push the price down towards the lower boundary of the channel, the next support level could be located at 1800 SAT and further support may be found at 1700 SAT and below. Meanwhile, the technical indicator Relative Strength Index (14) keeps moving in the same direction, suggesting a sideways movement for the coin.
Looking to buy or trade Ripple (XRP) now? Invest at eToro!
68% of retail investor accounts lose money when trading CFDs with this provider
Read more:
Credit: Source link


")


 Bitcoin
  Ethereum
  Tether
  BNB
BNB  Solana
  USDC
USDC  XRP
XRP  Dogecoin
  Toncoin
  Cardano
  Shiba Inu
  Avalanche
  Wrapped Bitcoin
  Polkadot
  Bitcoin Cash
  NEAR Protocol
  Polygon
  Litecoin
  Uniswap
  Fetch.ai
  LEO Token
  Aptos
Aptos  Hedera
  First Digital USD
  Pepe
Pepe  Cosmos Hub
  dogwifhat
  Filecoin
  Render
  Immutable
  Stellar
  XT.com
  Optimism
  OKB
OKB  Bittensor
  Arbitrum
  Wrapped eETH
  Maker
Maker  The Graph
