
Ripple Price Prediction – January 8
The Ripple price prediction reveals that XRP is currently facing selling pressure below the $0.75 after touching $0.78 high.
XRP/USD Market
Key Levels:
Resistance levels: $0.90, $0.95, $1.00
Support levels: $0.60, $0.55, $0.50
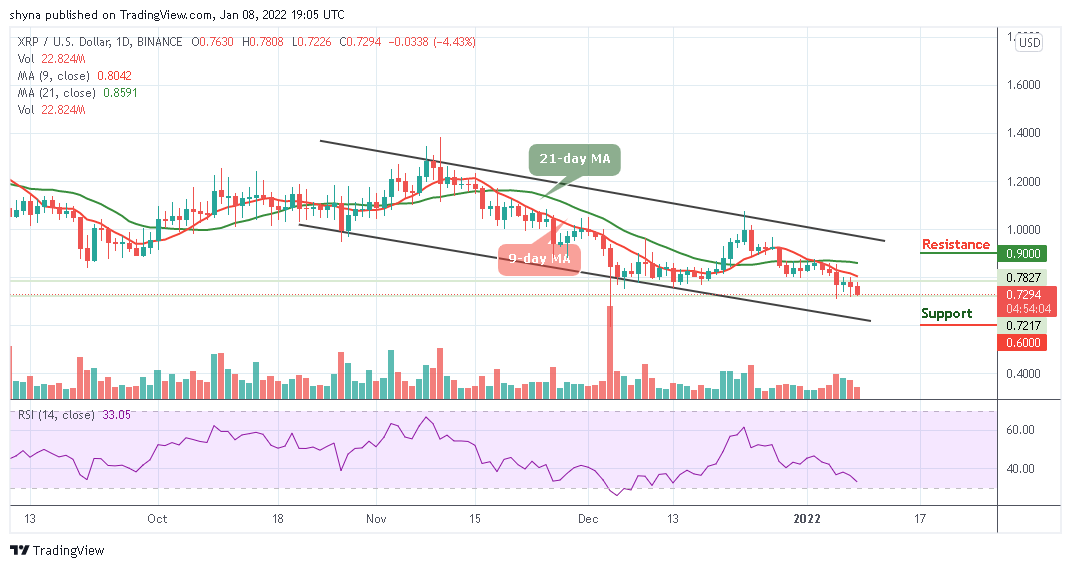
XRP/USD is declining below the 9-day and 21-day moving averages after touching the daily high at $0.78. The Ripple price might cross below the $0.70 level before it could begin another increase. However, after struggling to break above the 9-day moving average, the Ripple begins a slow and steady decline as the coin prepares for the nearest $0.93 support level, which could move the Ripple (XRP) to a short-term low.
Ripple Price Prediction: Ripple (XRP) May Fall More
The Ripple price is currently changing hands at $0.72 and any attempt to drag them to the lower boundary of the channel could open the door to the downsides. On the other hand, any bullish move above the 9-day moving average and crossing the 21-day moving average may find resistance levels of $0.90, $0.95 and $1.00.
Moreover, the market may experience a quick bullish movement if the trade reaches the support at $0.60 and should the price fail to rebound, then a bearish breakout is likely to trigger more selling opportunity for traders, which might cause the price to drop to $0.60, $0.55, and $0.50 support levels respectively. Now, the technical indicator Relative Strength Index (14) is likely to cross into the oversold region to increase the downtrends.

Against Bitcoin, the Ripple is currently trading at the 1785 SAT as it is crossing below the 9-day and 21-day moving averages. If the above-mentioned level could serve as market support, XRP/BTC can be pushed back to the positive side and may move towards the resistance level of the 1900 SAT and above.
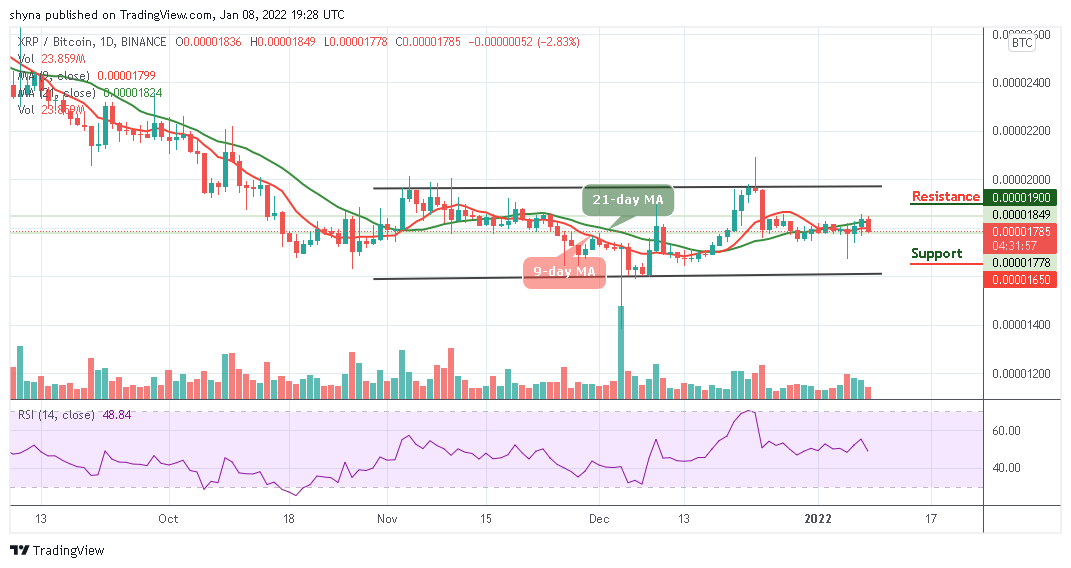
However, if the buyers fail to reclaim back the leadership of the market, it may continue the downtrend and it could probably record further declines toward the lower boundary of the channel. This could push the market to the nearest support level at 1650 SAT and below. Meanwhile, the Relative Strength Index (14) is crossing below 50-level to confirm the bearish signals.
Looking to buy or trade Ripple (XRP) now? Invest at eToro!
68% of retail investor accounts lose money when trading CFDs with this provider
Credit: Source link


 Trading Volume Plunges")


 gains new market attention")


 Bitcoin
  Ethereum
  Tether
  BNB
BNB  Solana
  USDC
USDC  XRP
XRP  Dogecoin
  Toncoin
  Cardano
  Shiba Inu
  Avalanche
  Wrapped Bitcoin
  Bitcoin Cash
  Polkadot
  NEAR Protocol
  Polygon
  Litecoin
  Uniswap
  LEO Token
  First Digital USD
  Aptos
Aptos  Hedera
  Filecoin
  Stellar
  Cosmos Hub
  Render
  Pepe
Pepe  OKB
OKB  Immutable
  XT.com
  Arbitrum
  Bittensor
  Maker
Maker  Optimism
  dogwifhat
  Wrapped eETH
  The Graph
