
XRP Trade Oscillates at $0.80 – December 15
There have been smaller active moves in the XRP/USD market operations as the crypto trade oscillates at $0.80. Presently, the price witnesses a higher point at $0.82 and a lower value at $0.79 with a smaller negative percentage rate of about 0.57.
Trade Oscillates at $0.80: XRP Market
Key Levels:
Resistance levels: $0.90, $1.00, $1.10
Support levels: $0.70, $0.60, $0.50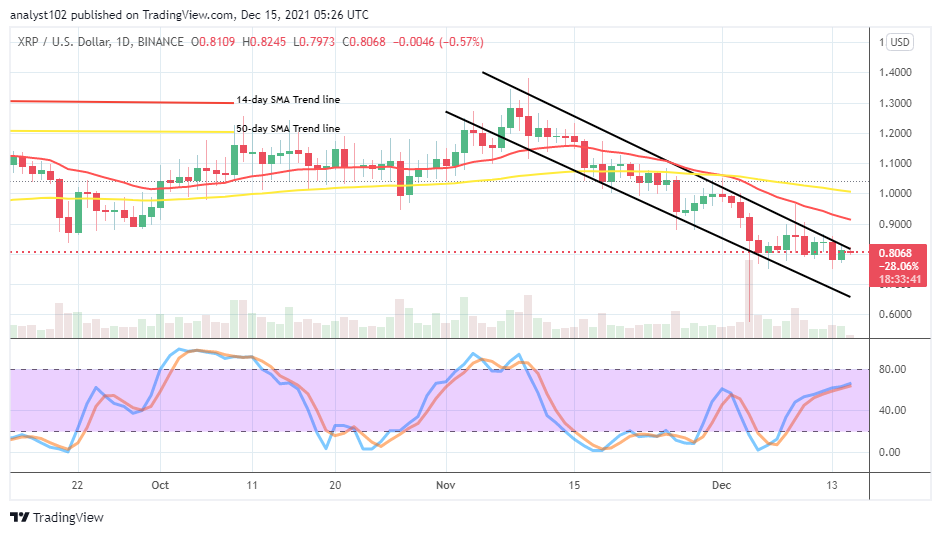
XRP/USD – Daily Chart
The Ripple XRP/USD daily chart reveals that the crypto-economic trade oscillates at $0.80, close to the upper bearish channel trend line. The 14-day SMA trend line is underneath the 50-day SMA trend line. The Stochastic Oscillators have tightly positioned and, slantingly moving northbound underneath the range of 80. That signifies the possibility of the market witnessing a pit stop.
Will the Ripple XRP/USD market go falling more as the crypto-economic trade oscillates at $0.80?
The current trading condition of the Ripple XRP/USD appears indecisive as the crypto-economic trade oscillates at $0.80. The market’s area of trading, around the upper bearish trend line, drew, constitutes a vital resistance zone to the situation. Buyers needed to add more catalysts above the support level at $0.70 to breakout the barrier around the present oscillating point.
On the downside of the technical analysis, the Ripple XRP/USD market short-position takers stand the brighter chance of pushing the market down while the price witnesses an active reversal around the upper bearish trend line at $0.80. In the event of heightening forces from that value line, the support level of $0.70 will breach for a moment. If that assumption plays out, it will be an opportunity for investors to buy more into the crypto economy.
.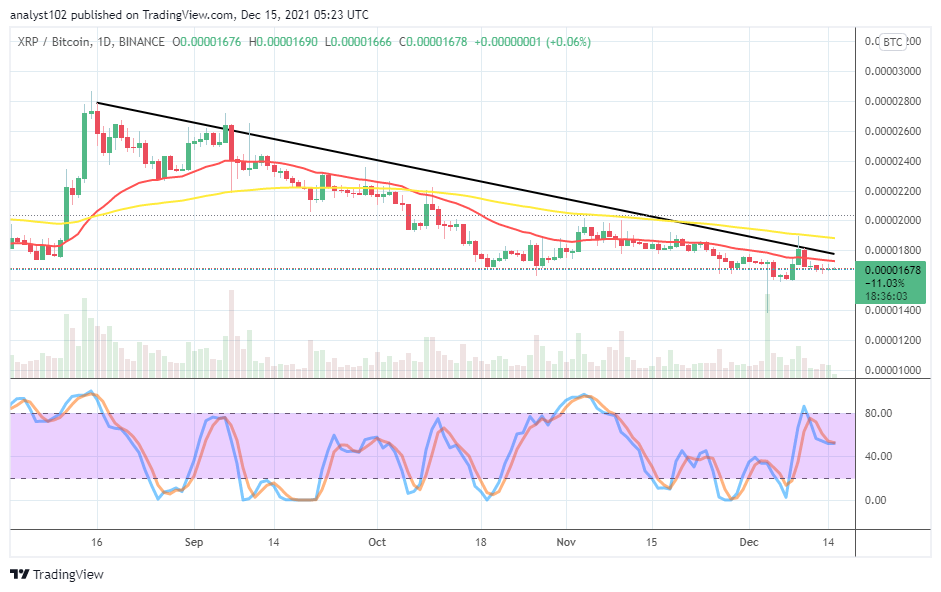
XRP/BTC Price Analysis
In comparison, Ripple XRP’s trending capacity outlook has remained been overwhelmed by Bitcoin. Presently, the cryptocurrency pair trade oscillates beneath the trend lines of the SMAs. The 14-day SMA indicator is underneath the 50-day SMA indicator. The Stochastic Oscillators have somewhat slantingly moved southbound from the range of 80, closing the lines at the range of 55. An indication suggests that the base crypto is mustering the energy to take a prelaunch against the flagship counter trading instrument.
Looking to buy or trade Bitcoin (BTC) now? Invest at eToro!

68% of retail investor accounts lose money when trading CFDs with this provider.
Read more:
Credit: Source link


 Becomes the Most Traded Altcoin of 2023: Experts Comment")


 Bitcoin
  Ethereum
  Tether
  BNB
BNB  Solana
  USDC
USDC  XRP
XRP  Dogecoin
  Toncoin
  Cardano
  Shiba Inu
  Avalanche
  Wrapped Bitcoin
  Bitcoin Cash
  Polkadot
  NEAR Protocol
  Polygon
  Litecoin
  Uniswap
  LEO Token
  First Digital USD
  Aptos
Aptos  Hedera
  Stellar
  Cosmos Hub
  Filecoin
  OKB
OKB  Render
  Pepe
Pepe  Immutable
  XT.com
  Arbitrum
  Bittensor
  Maker
Maker  dogwifhat
  Optimism
  Wrapped eETH
  The Graph