
Algorand Price Prediction – May 6
There is a sell signal in the ALGO/USD market operations as the crypto-economic swings low from a high point. The swinging high and low motions featured between $0.68 and $0.62 value lines at 1.26% positives.
ALGO/USD Market
Key Levels:
Resistance levels: $0.80, $1.00, $1.20
Support levels: $0.40, $0.30, $0.20
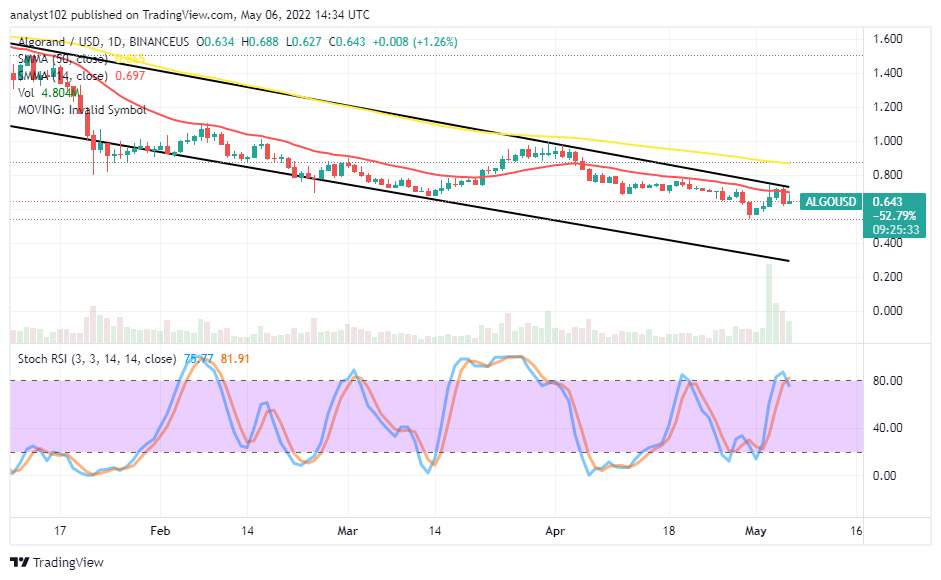 ALGO/USD – Daily Chart
The daily chart shows the Algorand market swings low from a high point against the valuation of the US Dollar. The 14-day SMA indicator is underneath the 50-day SMA indicator. And they are bent toward the south direction. The upper bearish channel trend line drew closely above the smaller SMA, playing a backing role to showcase variant psychological resistant trading points that the market keeps to the downside. The Stochastic Oscillators have crossed their lines slightly southbound at the 80 range.
As Algo swing low from a high point, will downward forces prevail in the subsequent trading operations?
An indication suggests that some lower lows may play out in the ALGO/USD market in the subsequent sessions as the crypto-economic price swings low from a high point. The falling pace may not be forthcoming aggressively. But, it could be in a sequential order characterized by tinier lower lows afterward until a reading is observed from the Stochastic Oscillators to signify an oversold region that can eventually attract a buying back moment.
On the downside of the technical analysis, the ALGO/USD market sellers have every chance to push the price down from a resistant trading spot closely beneath the $0.80 resistance level. Already, a bearish candlestick has emerged during yesterday’s sessions at the hitting of barrier spot around the trend line of the smaller SMA. The crypto business appears to lose stances presently in a less-active manner to allow bears to go on a ride for a while through some support levels between $0.60 and $0.40 in the long term if the downward force holds firmly.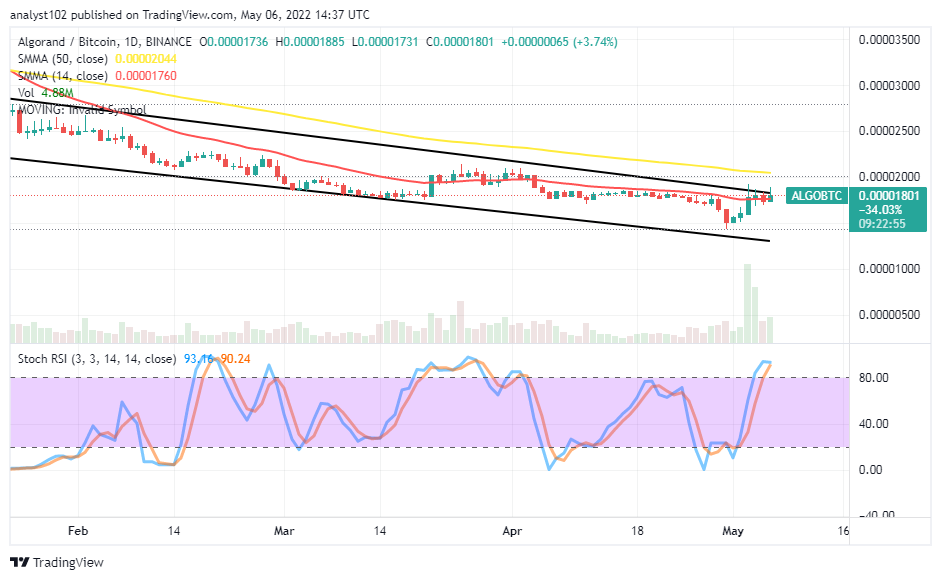
ALGO/BTC Price Analysis
Algorand, in the comparison against Bitcoin’s trending capacity on the price analysis chart, shows the base crypto is in a downward trending outlook with the counter crypto. The cryptocurrency pair market swings low around the smaller SMA. The 50-day SMA trading indicator is above the 14-day SMA trading indicator. The Stochastic Oscillators are in the overbought region, seemingly trying to close their lines within it. That could mean ALGO will experience a pit stop in its journey to the upside against Bitcoin. And that may lead to falling moves in the subsequent operations on a lighter mode.
Looking to buy or trade Algorand (Algo) now? Invest at eToro!

68% of retail investor accounts lose money when trading CFDs with this provider.
Read more:
Credit: Source link


 Wallet?")

, Ethereum (ETH), and Ripple (XRP): Who’s Set to Sink?")
 By $22 Million")


 Bitcoin
  Ethereum
  Tether
  BNB
BNB  Solana
  USDC
USDC  XRP
XRP  Dogecoin
  Toncoin
  Cardano
  Shiba Inu
  Avalanche
  Wrapped Bitcoin
  Bitcoin Cash
  Polkadot
  NEAR Protocol
  Polygon
  Litecoin
  Uniswap
  LEO Token
  First Digital USD
  Aptos
Aptos  Hedera
  Stellar
  Cosmos Hub
  Filecoin
  OKB
OKB  Immutable
  Pepe
Pepe  Render
  XT.com
  Arbitrum
  Bittensor
  Maker
Maker  Optimism
  dogwifhat
  Wrapped eETH
  The Graph