
ADA/USD – Buyers Rebound From $1.88 Support
Key Support Levels: $$2.00, $1.88, $1.80.
Key Resistance Levels: $2.20, $2.40, $2.50.
ADA bounced by a total of 6% over the past 24 hours since finding support at $2.00 yesterday. The cryptocurrency had broken beneath the 50-day MA on Monday and spiked lower on Tuesday until support was met at $1.88, provided by a 1.414 Fib Extension.
The buyers regrouped at $1.88, allowing them to push toward $2.00 when the daily candle closed. Yesterday, ADA bounced from $2.00 and continued beyond $2.20. It now needs to break the September descending trend line before attempting the 50-day MA around $2.40.
ADA-USD Short Term Price Prediction
Looking ahead, the first resistance lies around $2.20 (falling trend line). This is followed by $2.40 (bearish .382 Fib & 50-day MA), $2.50 (20-day MA), and $2.68 (bearish .618 Fib).
On the other side, the first strong support lies at $2.00. This is followed by $1.88 (downside 1.414 Fib Extension), $1.80 (100-day MA), $1.75 (.786 Fib), and $1.60 (200-day MA).
The RSI is heading back toward the midline, indicating the bearish momentum might be starting to fade.
ADA/BTC – ADA Rebounds From 4800 SAT Support.
Key Support Levels: 5000 SAT, 4800 SAT, 4715 SAT.
Key Resistance Levels: 5200 SAT, 5500 SAT, 6000 SAT.
ADA is also in the middle of a recovery against BTC as it broke above the 50-day MA to sit above 5000 SAT. The cryptocurrency fell beneath 5000 SAT last week and continued below the 50-day MA on Sunday to meet the support at 4800 SAT.
The market held 4800 SAT through the early days of this week and eventually surged above the 50-day MA and 5000 SAT yesterday to reach as high as 5200 SAT. It has since dropped back to 5000 SAT.
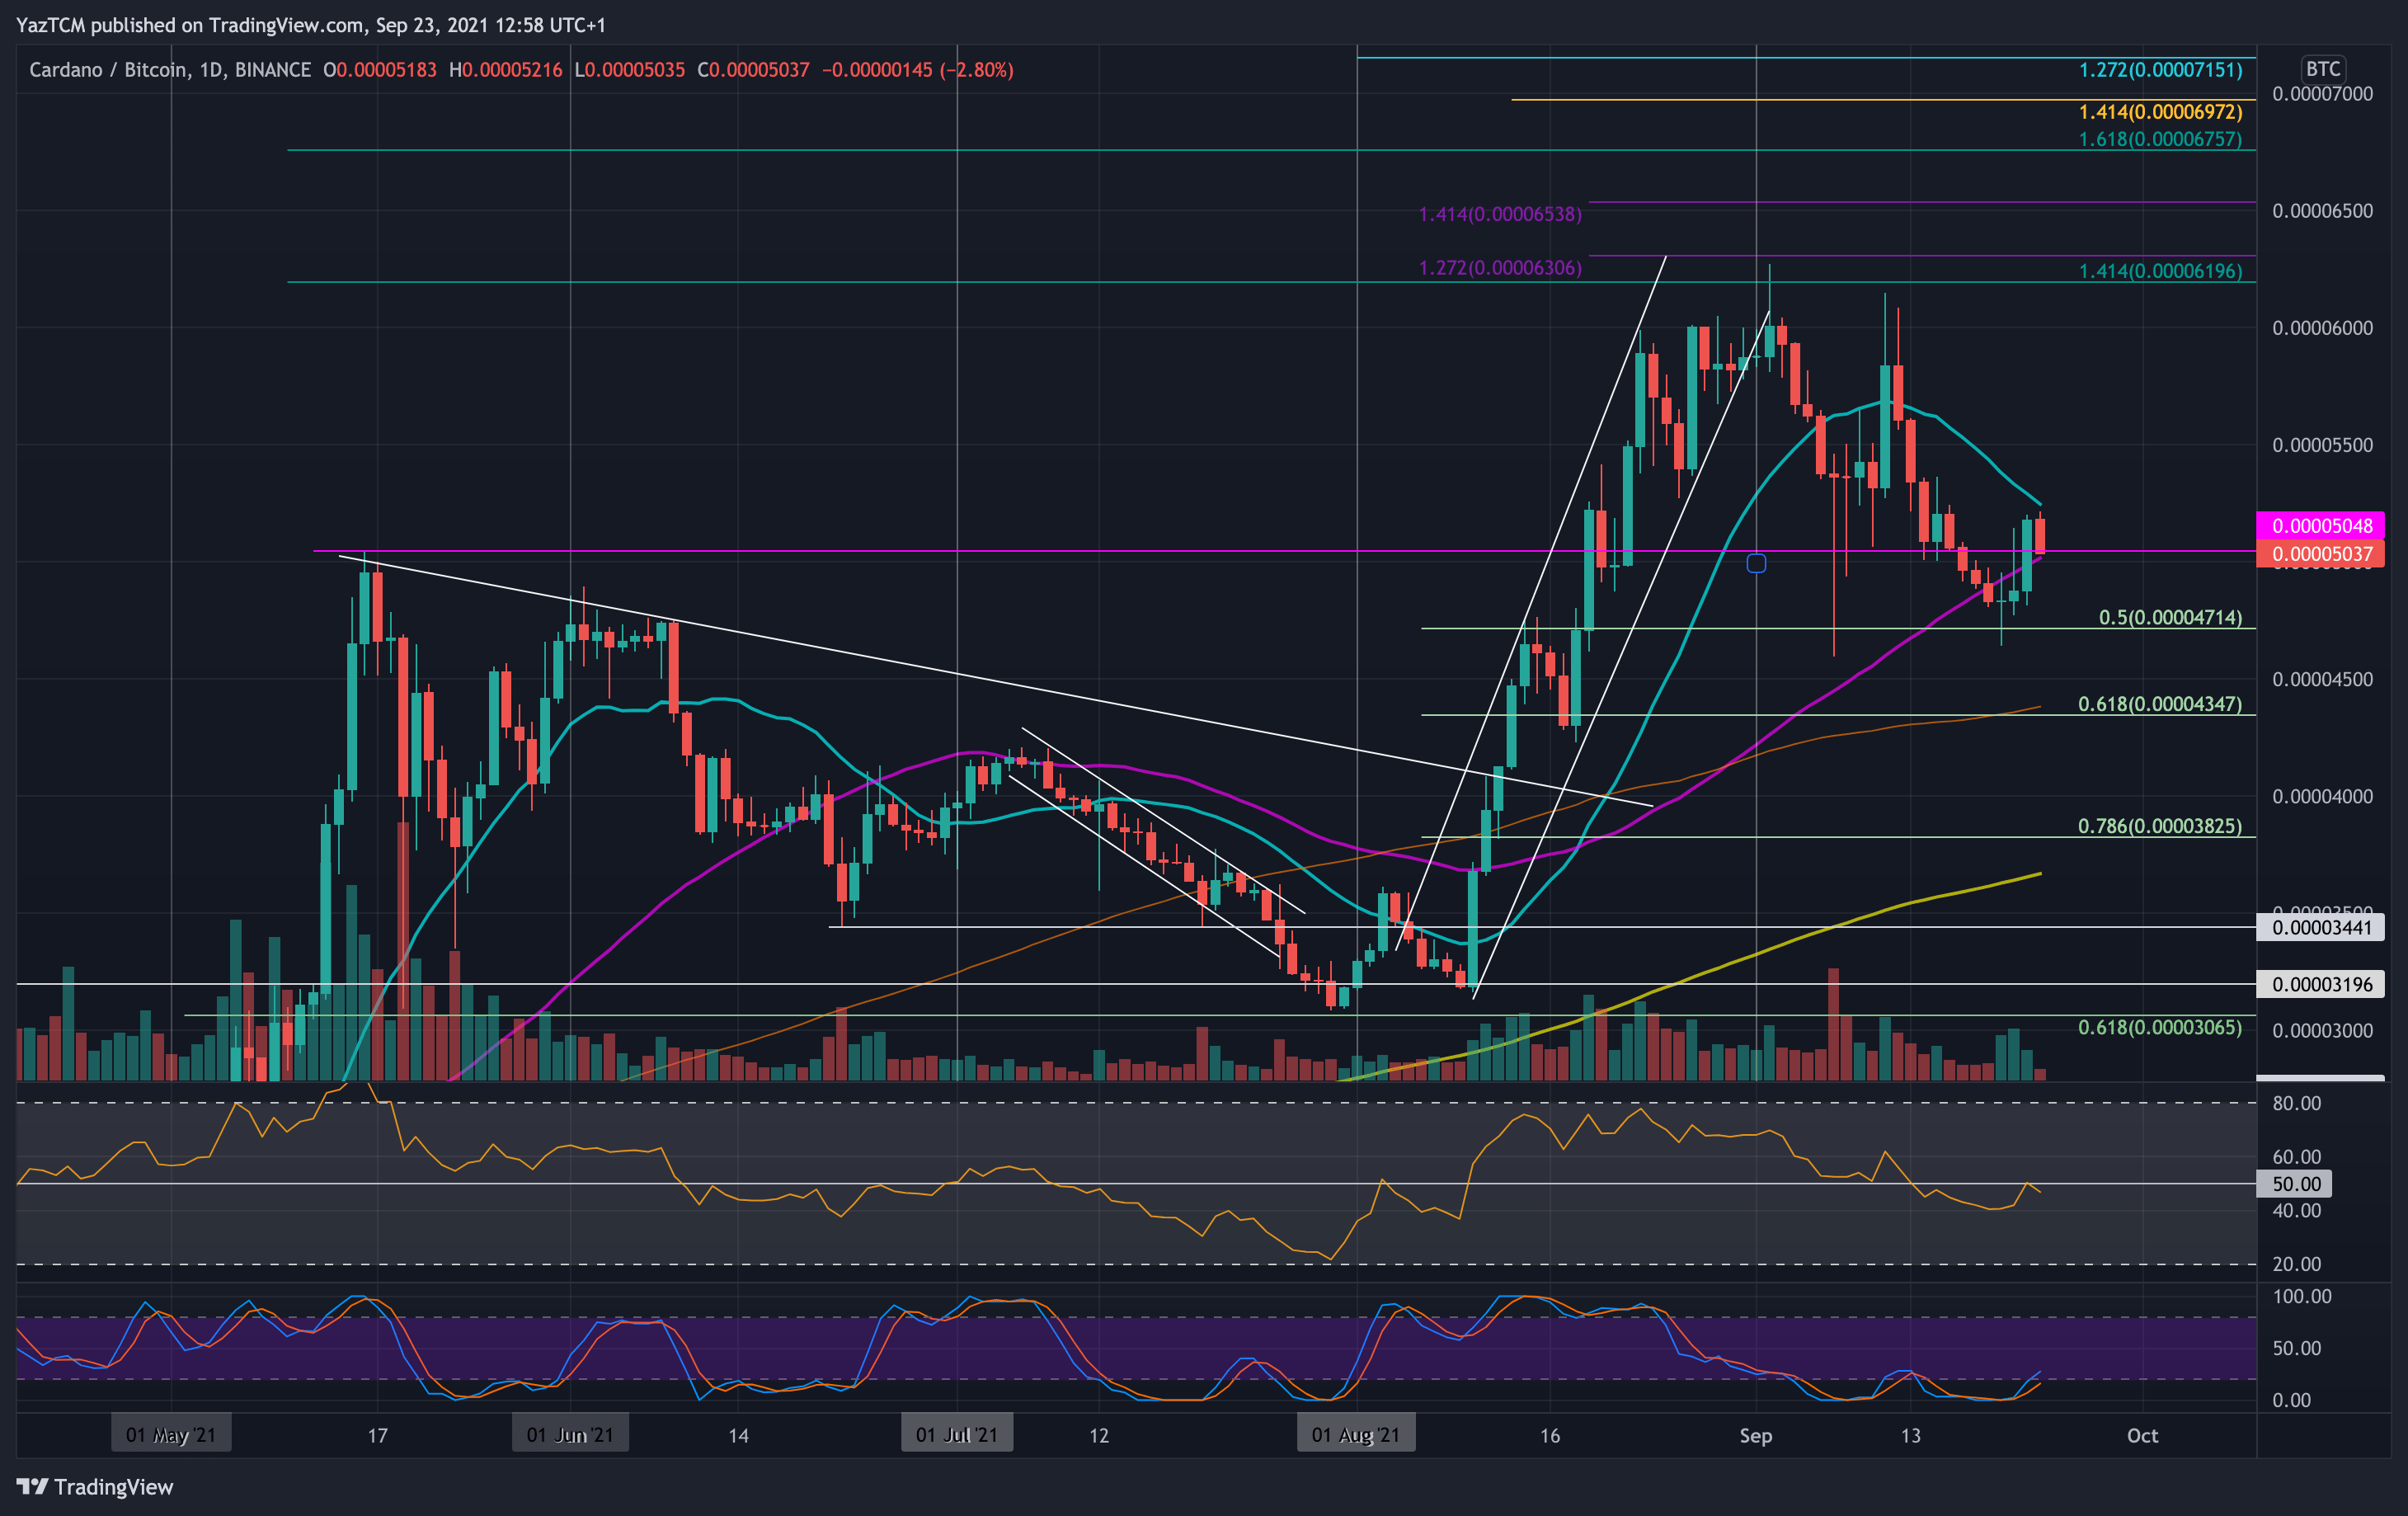
ADA-BTC Short Term Price Prediction
Looking ahead, the first resistance lies at 5200 SAT (20-day MA). This is followed by 5500 SAT, 6000 SAT, and 6300 SAT (1.272 Fib Extension).
On the other side, the first support lies at 5000 SAT (50-day MA). This is followed by 4800 SAT, 4714 SAT (.5 Fib0, 4500 SAT, and 4350 SAT (.618 Fib & 100-day MA).
The RSI remains beneath the midline and was recently rejected from the level, indicating the bears are still battling to push beneath 5000 SAT.
Credit: Source link


 Bitcoin
  Ethereum
  Tether
  BNB
BNB  Solana
  USDC
USDC  XRP
XRP  Dogecoin
  Toncoin
  Cardano
  Shiba Inu
  Avalanche
  Wrapped Bitcoin
  Bitcoin Cash
  Polkadot
  NEAR Protocol
  Polygon
  Litecoin
  Uniswap
  LEO Token
  First Digital USD
  Aptos
Aptos  Hedera
  Stellar
  Cosmos Hub
  Filecoin
  Pepe
Pepe  OKB
OKB  Render
  Immutable
  XT.com
  Arbitrum
  Bittensor
  dogwifhat
  Maker
Maker  Optimism
  Wrapped eETH
  The Graph
