
Over the past month, Bitcoin’s price has fluctuated with every major macro event and regulatory announcement, such as the SEC’s recent lawsuits against Coinbase and Binance, which allege multiple securities violations and contain language that could reshape the industry.
These events have only introduced more volatility, and even though Bitcoin’s price swings have not been as aggressive as they could be, they have led to a chaotic and uncertain market atmosphere.
Nevertheless, this has not deterred long-term holders from accumulating.
Diamond hands forever
Long-term holders are addresses that have held onto their coins for at least 155 days without moving them, showing a more patient and long-term investment approach to Bitcoin. As such, they serve as a vital indicator of market sentiment, as short-term market fluctuations are less likely to affect them.
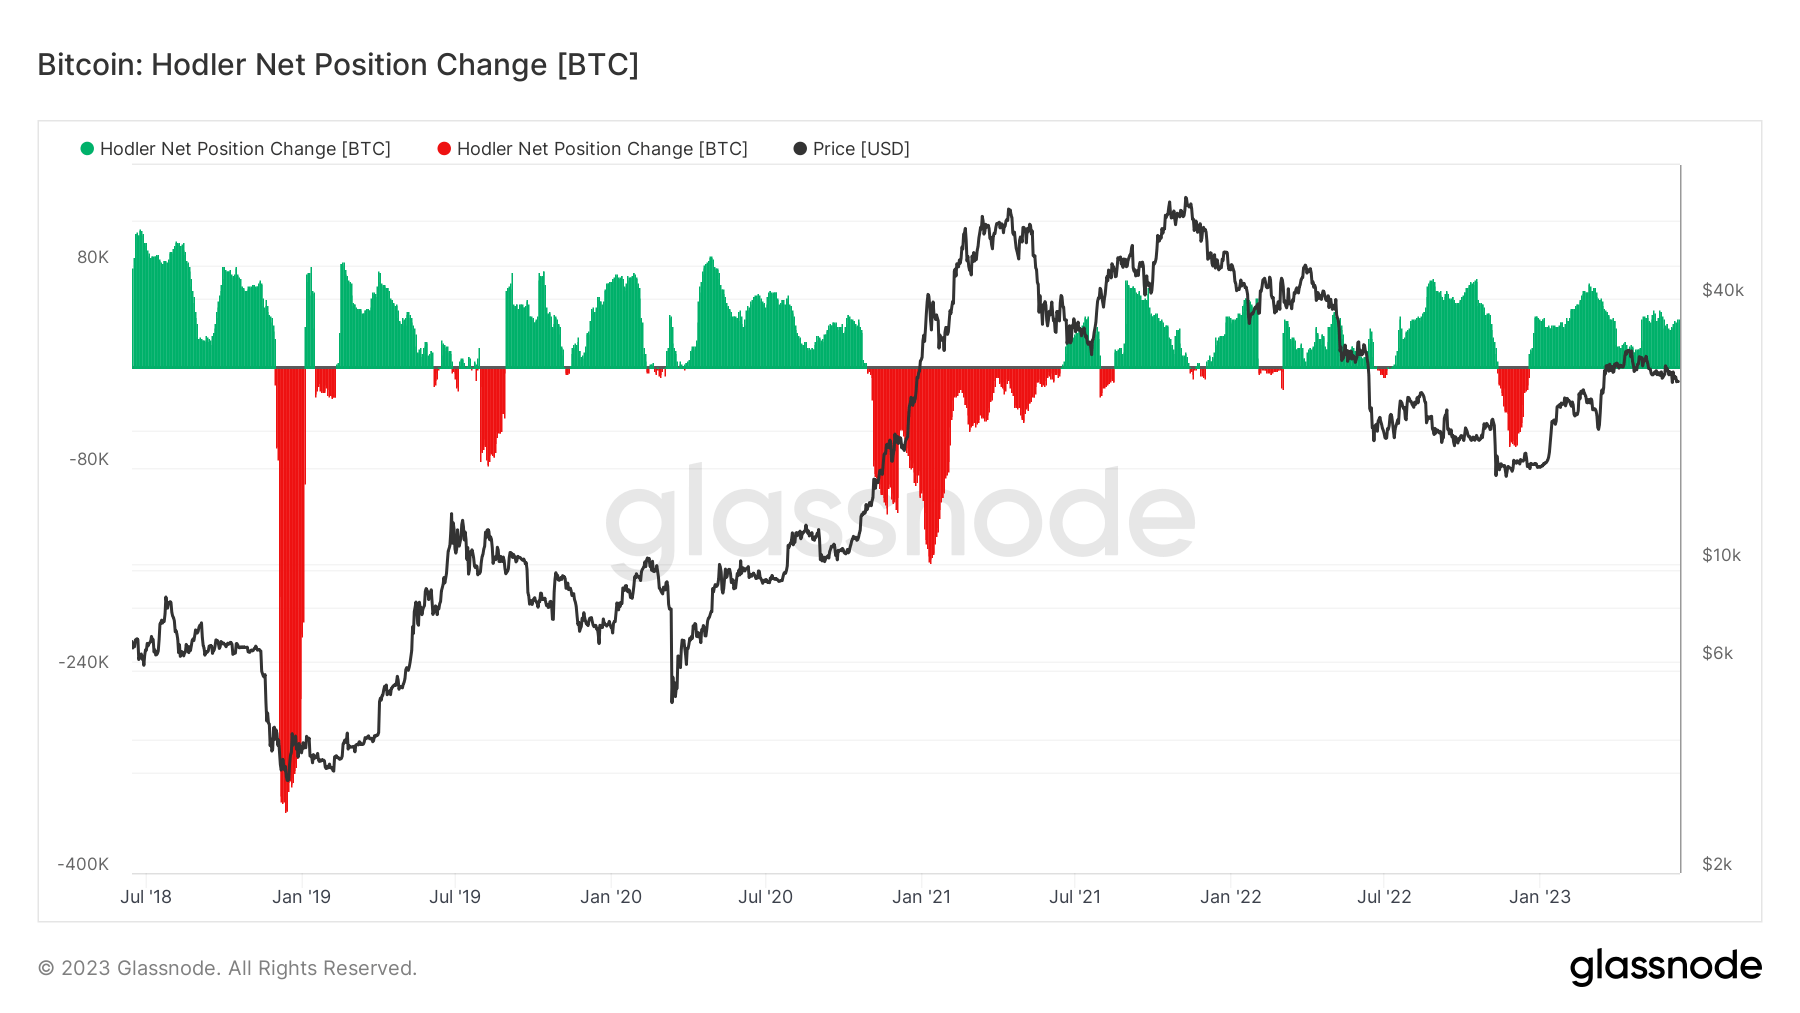
Despite the ongoing market uncertainty, holders have continued their Bitcoin accumulation. Data from Glassnode showed that holders have been increasing their BTC position since the beginning of the year, with every single day showing a positive change in their position.
A notable accumulation spike was observed in early May, sparking a new wave of accumulation. As of June 12, hodlers were increasing their positions at a rate of 39,233 BTC per month.
Historically, net changes in hodler positions have been inversely correlated with Bitcoin’s price fluctuations — when Bitcoin’s price peaks, long-term hodlers decrease their positions. This indicates experienced market participants tend to buy more Bitcoin when its price is low and sell when the price increases.
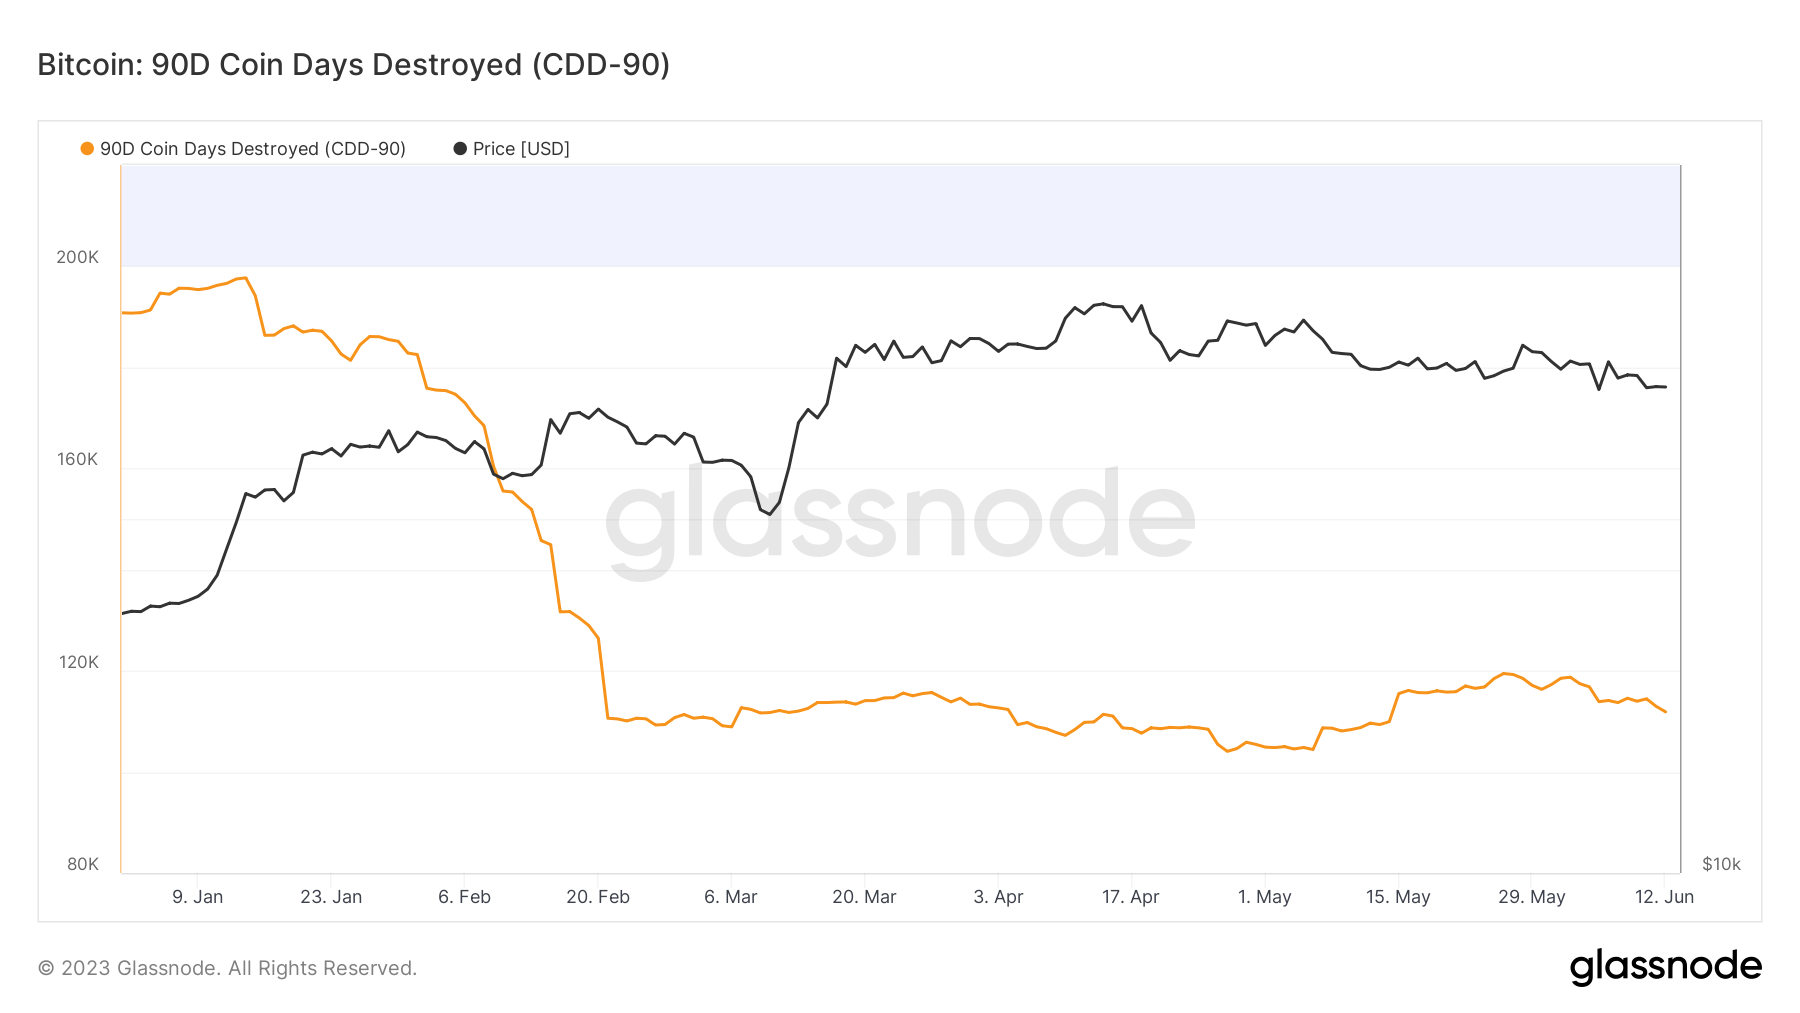
Another on-chain metric, Coin Days Destroyed 90 (CDD-90), further supports this accumulation trend.
Coin Days Destroyed is a way of measuring the movement of old coins. Holding a single Bitcoin for a day creates one coin day, while moving the Bitcoin destroys the coin day. CDD tracks the total age of all Bitcoins moved on a given day, providing insight into how many older coins held by long-term holders are on the move.
And while CDD provides a solid overview of the state of old coins, CDD-90 is a much more relevant measure. The metric adds up all the CDD from the past 90 days, providing a better insight into Bitcoin’s economic activity over a more extended period. An uptrend in CDD indicates holders who own coins with long lifespans are selling, while a downtrend shows a decrease in interest.
Since February 21, the CDD-90 has been moving sideways. This suggests that hodlers have slowed their spending and are increasing their Bitcoin positions. This accumulation reduces the amount of Bitcoin available in the market, tightening the supply.
The accumulation from long-term hodlers and the sideways trend of the CDD-90 suggest a continuous interest in Bitcoin that defies the uncertain conditions in the market. While the immediate future of Bitcoin remains uncertain given the complexity of the macro and intra-industry factors at play, these metrics indicate a silent but firm confidence in the asset.
The post Hodlers keep accumulating Bitcoin in wake of US regulation onslaught appeared first on CryptoSlate.
Credit: Source link


 Bitcoin
  Ethereum
  Tether
  BNB
BNB  Solana
  USDC
USDC  XRP
XRP  Dogecoin
  Toncoin
  Cardano
  Shiba Inu
  Avalanche
  Wrapped Bitcoin
  Bitcoin Cash
  Polkadot
  NEAR Protocol
  Polygon
  Litecoin
  Uniswap
  LEO Token
  First Digital USD
  Aptos
Aptos  Hedera
  Stellar
  Cosmos Hub
  Filecoin
  Render
  OKB
OKB  Immutable
  XT.com
  Pepe
Pepe  Arbitrum
  Bittensor
  dogwifhat
  Optimism
  Maker
Maker  Wrapped eETH
  The Graph
