
Ripple Price Prediction – February 28
The Ripple price prediction reveals that XRP is down by 0.35% as the current market value drops below the moving averages.
XRP/USD Market
Key Levels:
Resistance levels: $0.90, $0.95, $1.00
Support levels: $0.55, $0.50, $0.45
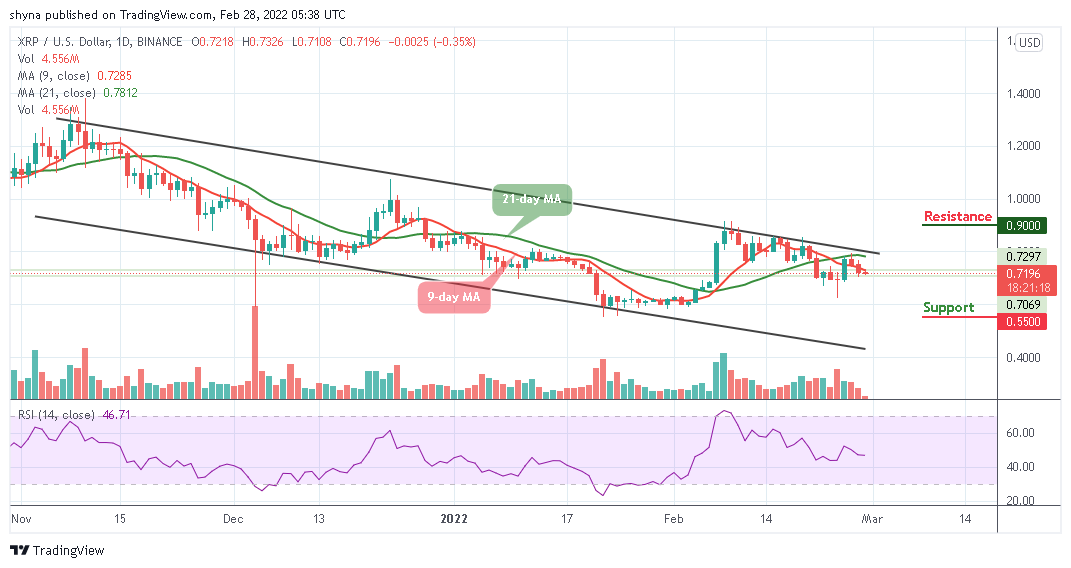
XRP/USD is currently giving a bearish signal as the coin heads below the opening price of $0.72. The technical indicator Relative Strength Index (14) remains below 50-level, and a further bearish movement towards the lower boundary of the channel could move the coin to another low, but if the market price crosses above the 9-day and 21-day moving averages, a bullish scenario may surface.
Ripple Price Prediction: Price May Continue with the Downside
According to the daily chart, the Ripple price demonstrates some weaknesses as the market is down by 0.35%. XRP/USD continues to reflect a price drop in the market, the fall might become heavy if the bearish action continues. At the moment, the Ripple price is moving bearishly, traders can expect the coin to continue to head lower below the 9-day moving average.
However, a break above the upper boundary of the channel could strengthen the bulls and may push the price to the resistance levels of $0.90, $0.95, and $1.00, while a breakdown might lead the market in a bearish scenario if the price continues to fall and it may likely reach the supports at $0.55, $0.50, and $0.45.

Against Bitcoin, the Ripple price is seen below the 9-day and 21-day moving averages, and if the selling pressure continues, XRP/BTC may create another low. At the moment, the technical indicator Relative Strength Index (14) is likely to cross below 50-level, but the market may continue to see a negative move as soon as the 9-day moving average crosses below the 21-day moving average.
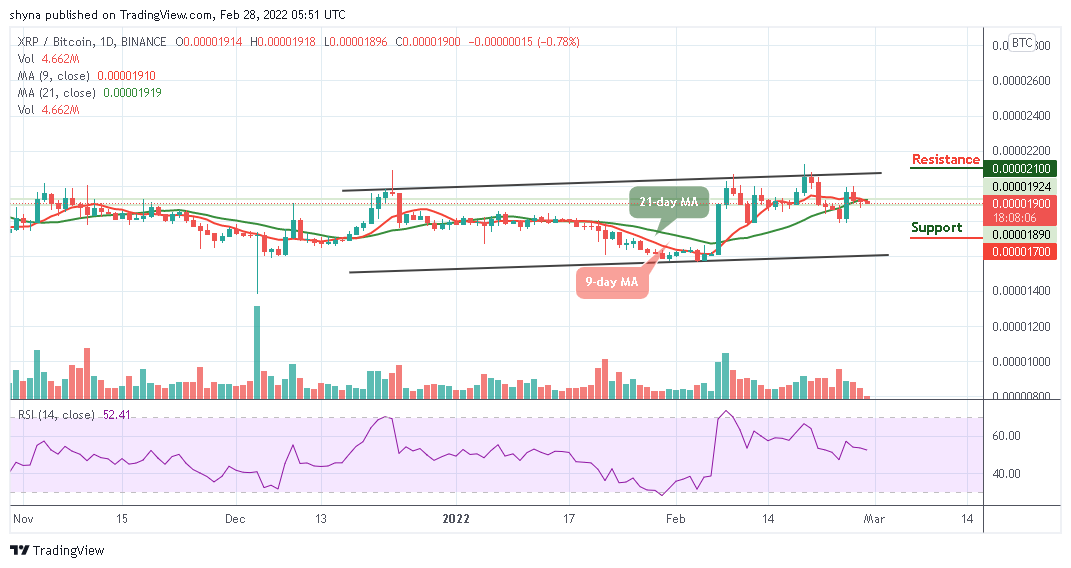
However, the Ripple (XRP) is currently hovering at 1900 SAT and if the coin slides toward the lower boundary of the channel, traders may expect close support at 1700 SAT and below. In other words, should in case a bullish movement occurs and break above the 9-day and 21-day MAs; traders can then confirm a bullish movement for the coin as the nearest resistance level may be found at 2100 SAT and above.
Looking to buy or trade Ripple (XRP) now? Invest at eToro!
68% of retail investor accounts lose money when trading CFDs with this provider
Credit: Source link


 Letter on Benefits and Challenges for Children in the Metaverse")


 Bitcoin
  Ethereum
  Tether
  BNB
BNB  Solana
  USDC
USDC  XRP
XRP  Dogecoin
  Toncoin
  Cardano
  Shiba Inu
  Avalanche
  Wrapped Bitcoin
  Bitcoin Cash
  Polkadot
  NEAR Protocol
  Polygon
  Litecoin
  Uniswap
  LEO Token
  First Digital USD
  Aptos
Aptos  Hedera
  Filecoin
  Stellar
  Cosmos Hub
  XT.com
  OKB
OKB  Render
  Pepe
Pepe  Immutable
  Arbitrum
  dogwifhat
  Bittensor
  Wrapped eETH
  Maker
Maker  Optimism
  Arweave
